


Meteorologists like to categorize and rank things, and snowstorms are no exception. That’s where the Regional Snowfall Index comes in.
NOAA’s National Centers for Environmental Information started officially using the Northeast Snowfall Impact Scale (NESIS) in 2005. NESIS ranks snowstorms not just on weather, but on societal impacts.
It uses population and historical snowfall information from the eastern two-thirds of the U.S. and applies that to Northeast snowstorms. Big snows falling on big cities have big impacts, so NESIS accounts for that by incorporating how much snow fell over an area and the population affected.
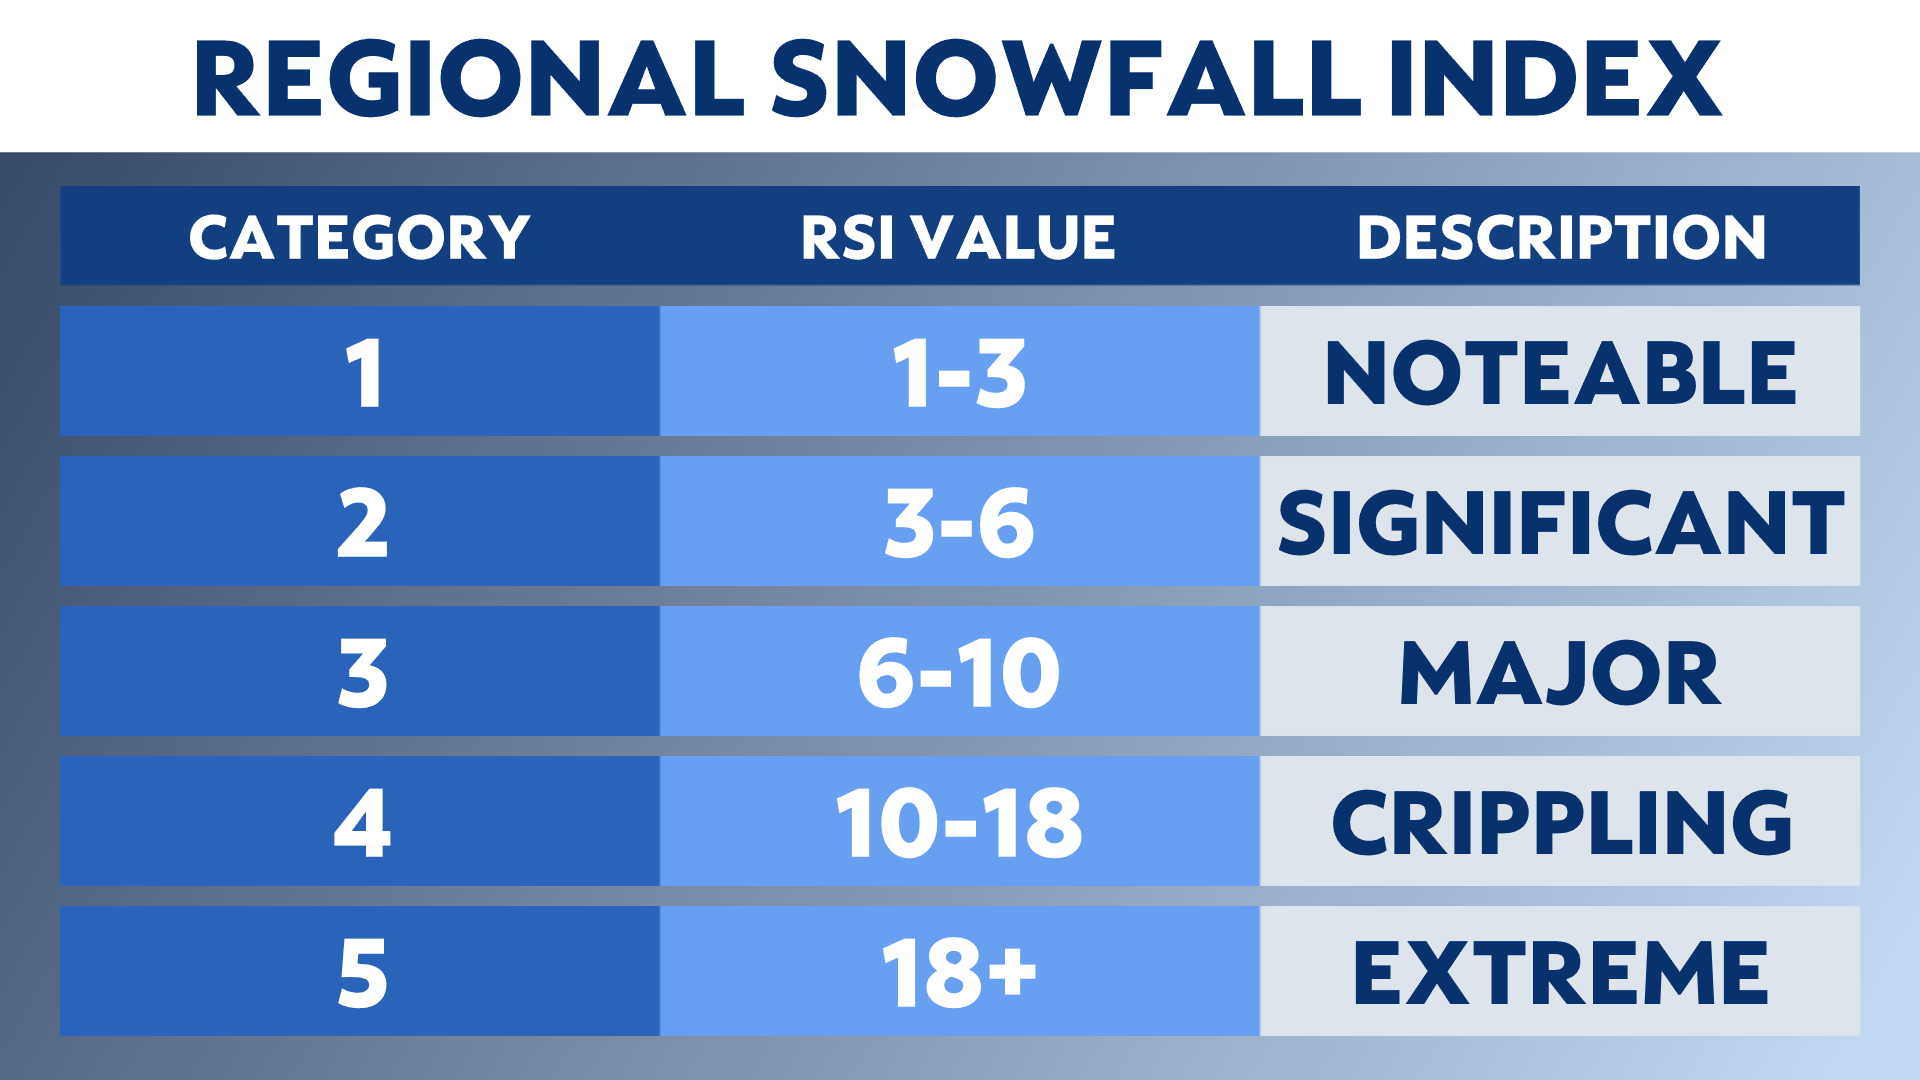
All that data leads to a score, which corresponds to a 1-5 scale.
However, the calculation doesn’t work well in other areas. For example, a snowstorm in North Carolina that’s significant by Southern standards might not even rank using the NESIS formula.
That’s where the Regional Snowfall Index comes in. The RSI ranks storms based on the historical particulars of smaller regions. Like the NESIS, it gives storms a 1-5 rating based on population and snowfall.
Like the Enhanced Fujita tornado damage scale, NESIS and RSI rate snowstorms after they’ve happened.
Wondering what the RSI says the top three snowstorms are in the Upper Midwest?
#1: Jan. 23-28, 1978
RSI: 39.072, Category 5
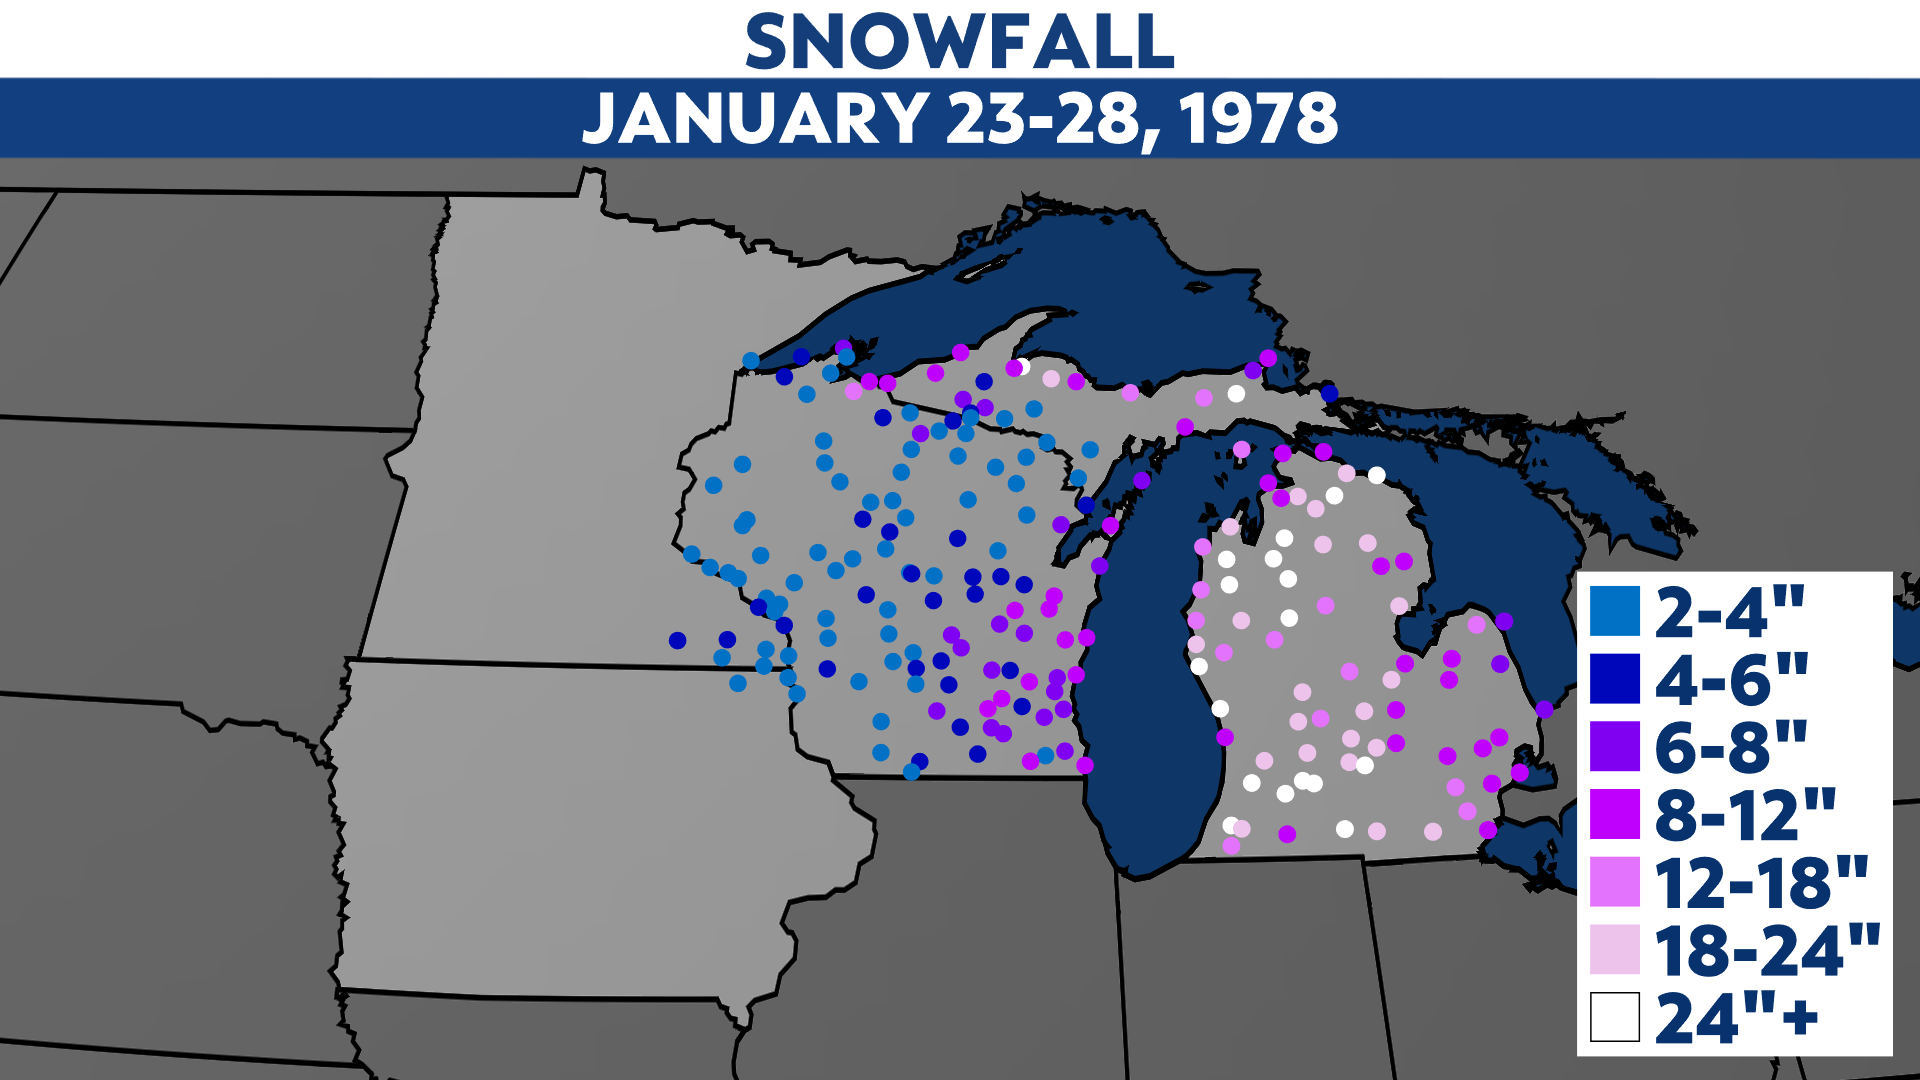
Those who lived in the Midwest in the late 1970s probably remember some pretty harsh winters and big snowstorms. This one walloped Michigan, but grazed eastern Wisconsin with seasonably heavy snow.
#2: Oct. 31-Nov. 4, 1991
RSI: 30.175, Category 5
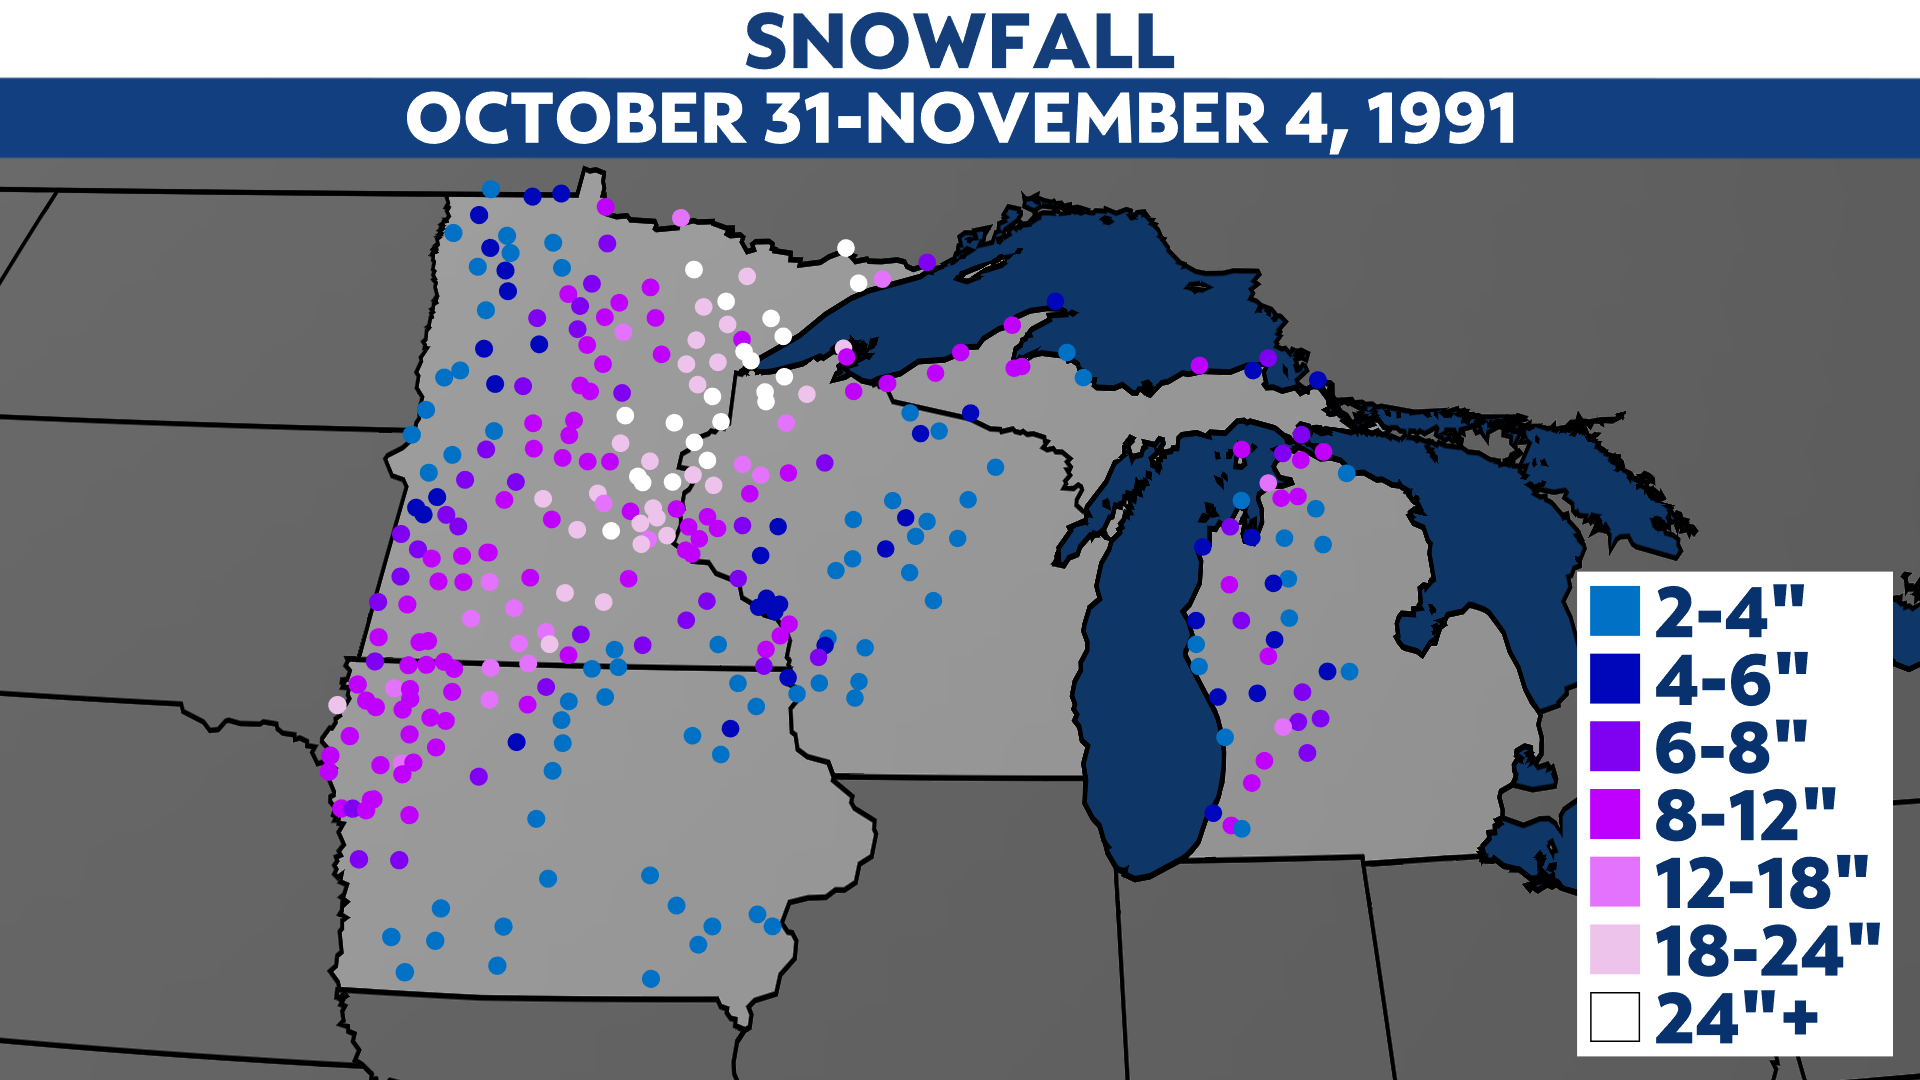
This Halloween snowstorm wasn't enough to keep everyone from trick-or-treating.
#3: Feb. 7-15, 1985
RSI: 27.062, Category 5
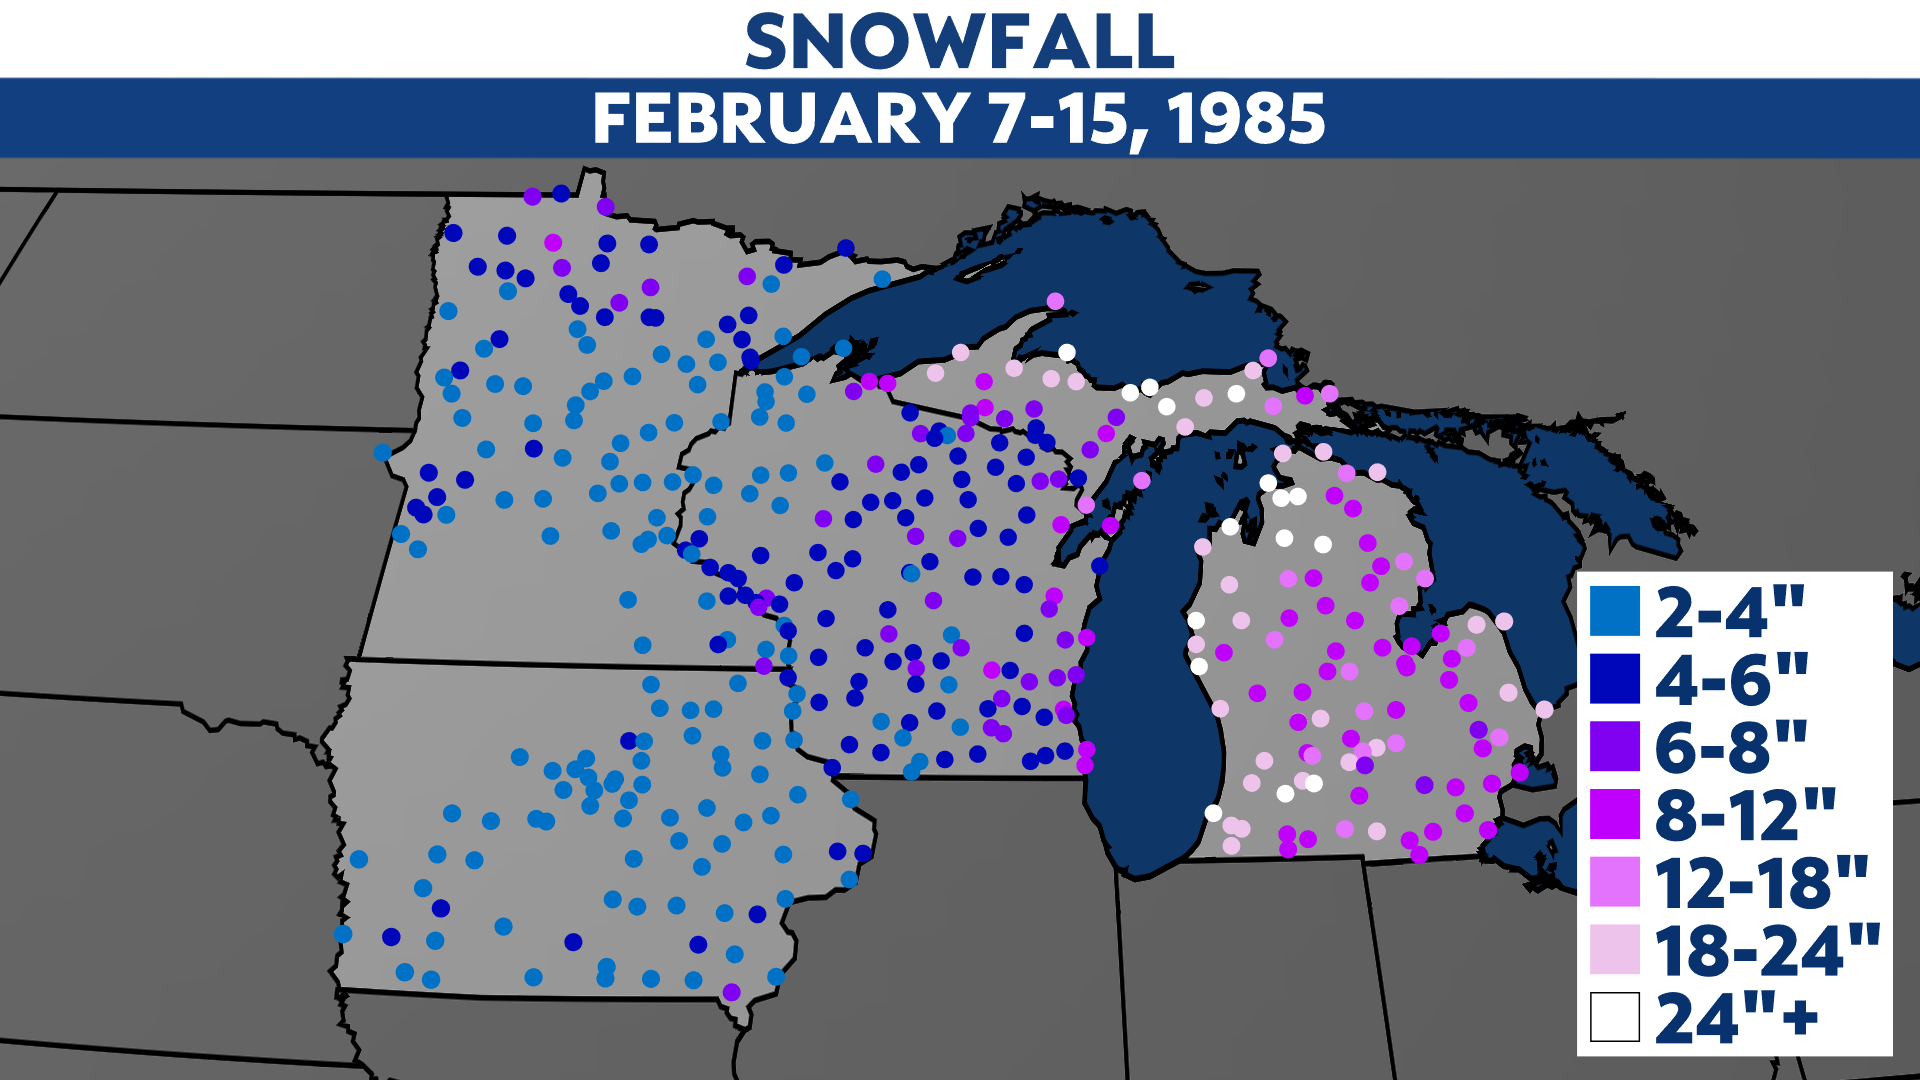
Michigan bore the brunt of this winter storm, but pretty much everybody in Wisconsin got accumulating snow – not an easy feat to accomplish.