


The Great Lakes, including Lake Erie, are significantly below average in ice coverage so far this season. This lack of ice does affect the Ohio Valley, especially northeast Ohio.
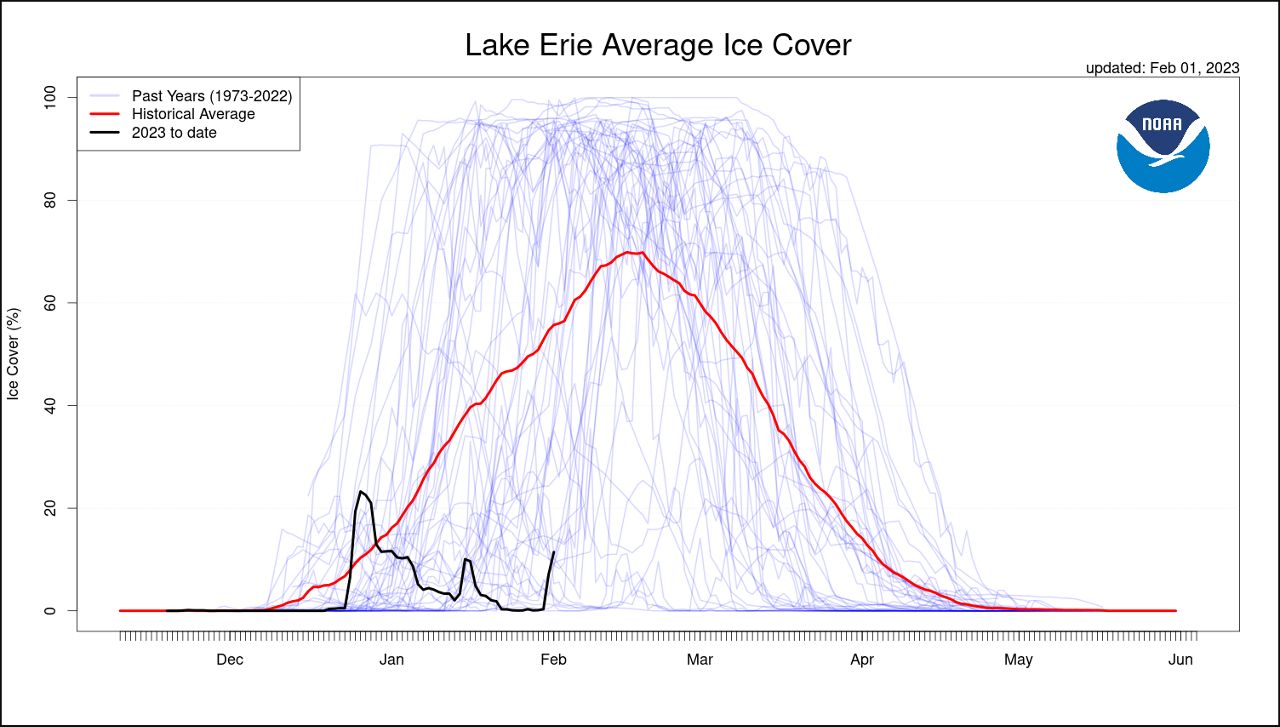
On Jan. 31, Lake Erie was only 7% covered in ice, which is dramatically different from the same day last year, when the lake’s ice coverage was at 93.8%.
Colder weather through the first couple of days of February has helped a bit. Ice coverage on Lake Erie bumped up to 12% on Feb. 2 and could go higher by early this weekend with more cold air.
However, temperatures once again warm into the 40s and 50s heading into mid-February. The rollercoaster trend this winter isn’t the greatest for maintaining Lake Erie’s ice coverage.
Typically, according to NOAA, the average date for maximum ice coverage on Lake Erie is Feb. 10. Annual ice coverage for Lake Erie averages about 75%.
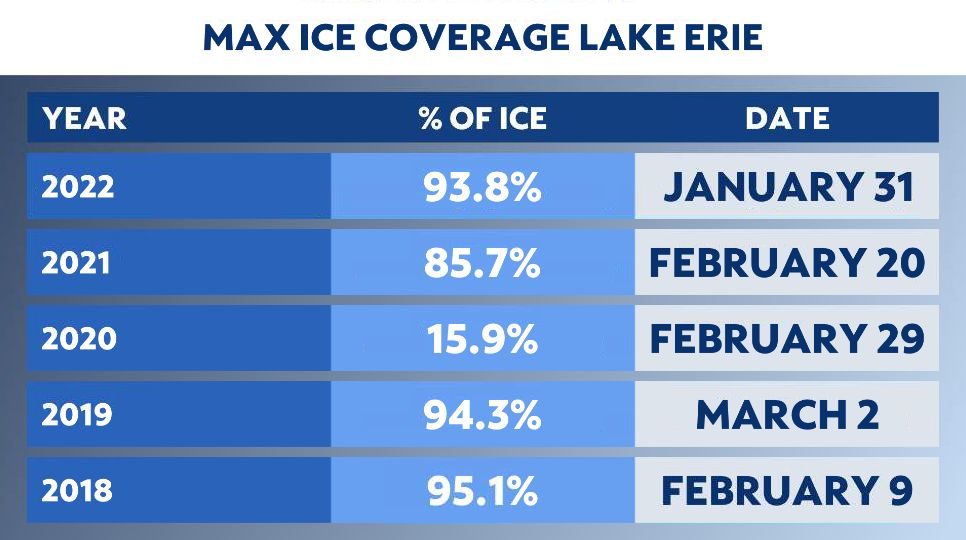
From year to year, the Great Lakes experience variability in ice cover. Check out the last five years for Lake Erie below.
Less ice heading into February potentially means more lake-effect snow than normal, or a longer season for it.
Lake Erie ice coverage normally gives a bit of a break from the lake-effect snow. But conditions could be different this February, something we will be monitoring.
Of course, a milder February wouldn't produce lake-effect snow showers, but blasts of colder air would kick start the lake-effect snow machine again!
Our team of meteorologists dives deep into the science of weather and breaks down timely weather data and information. To view more weather and climate stories, check out our weather blogs section.