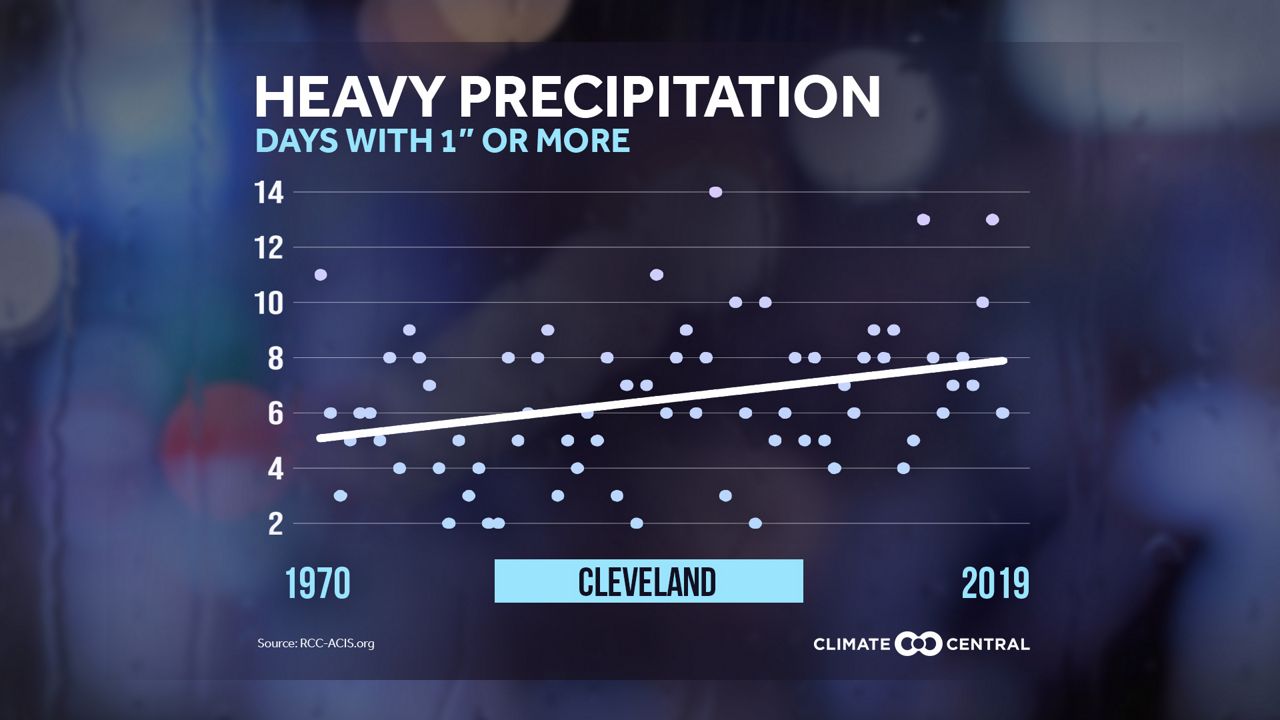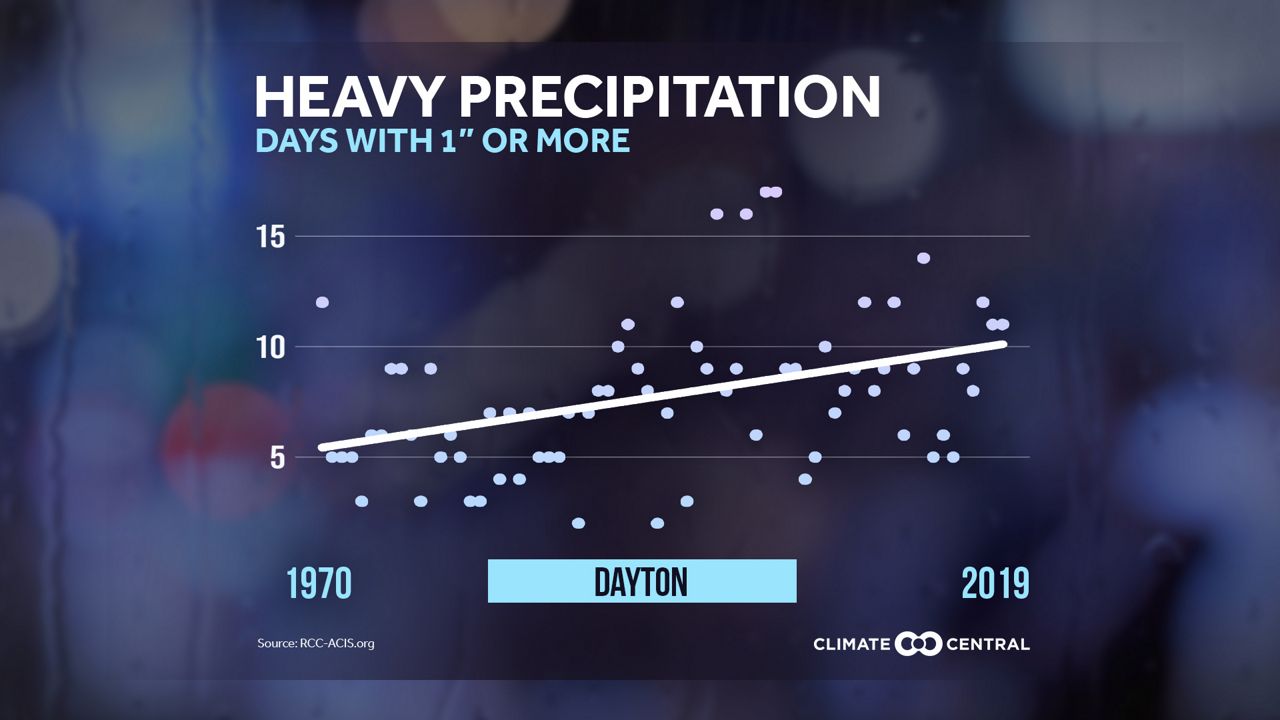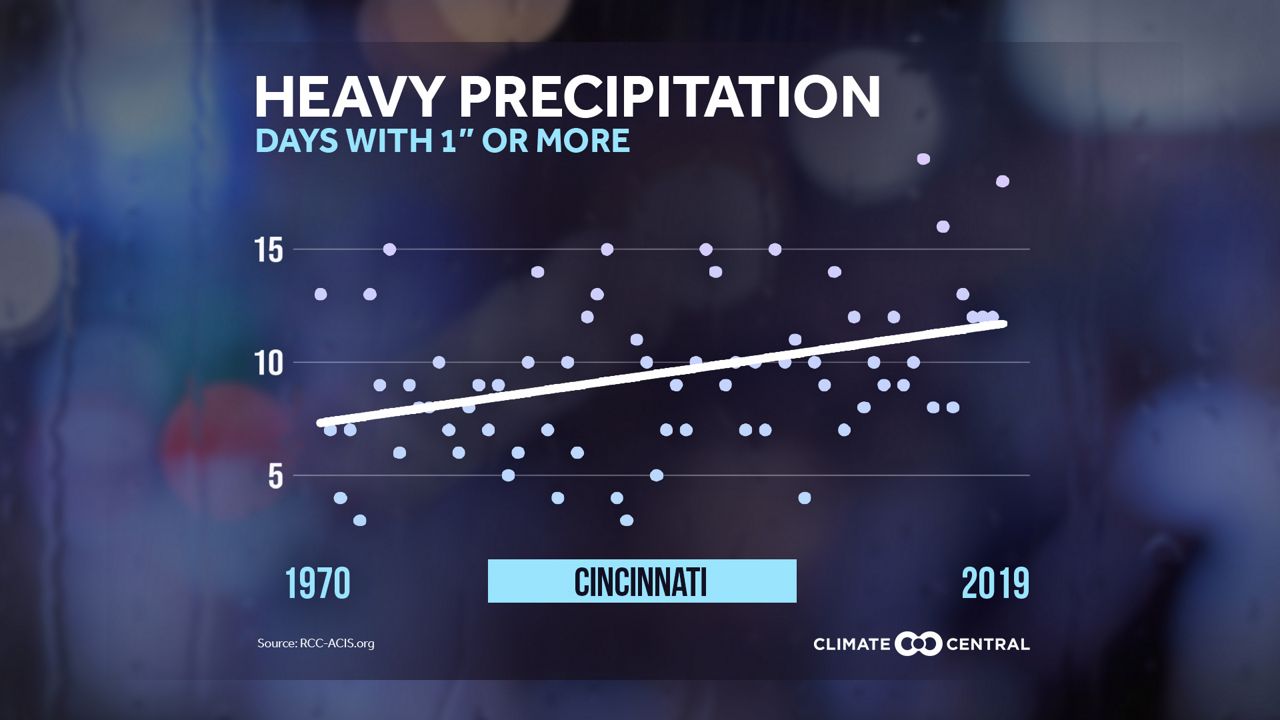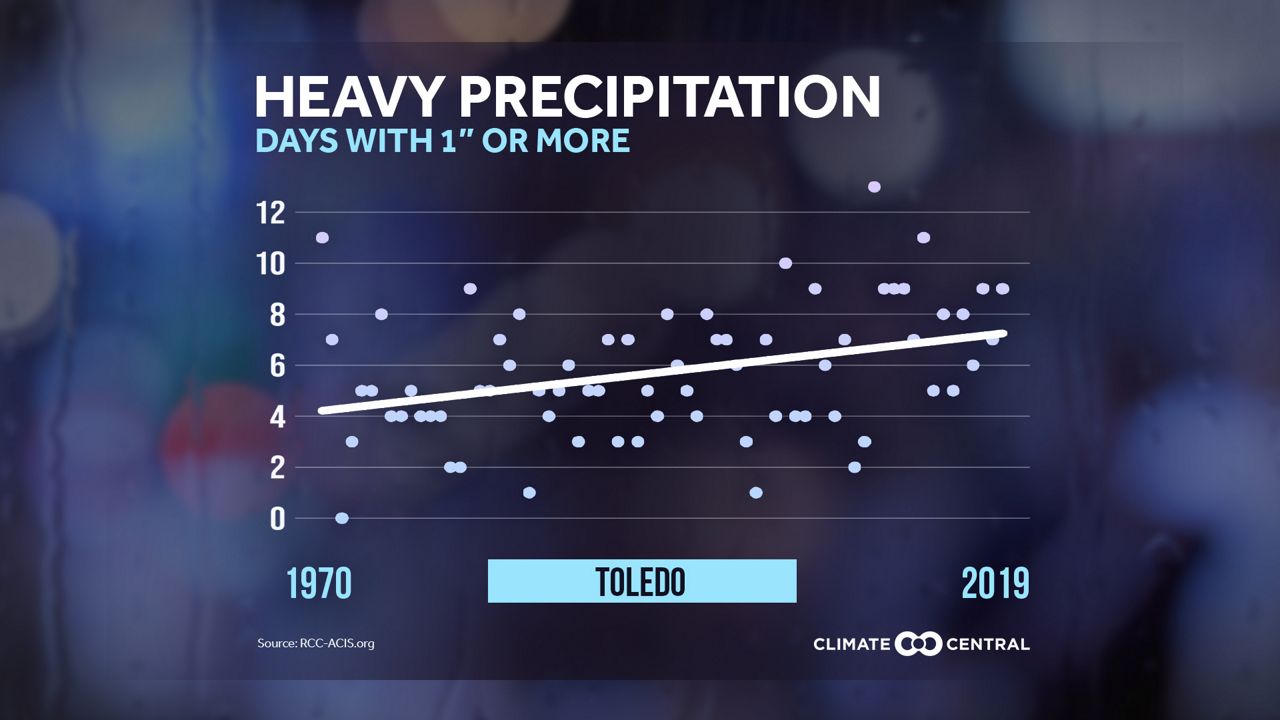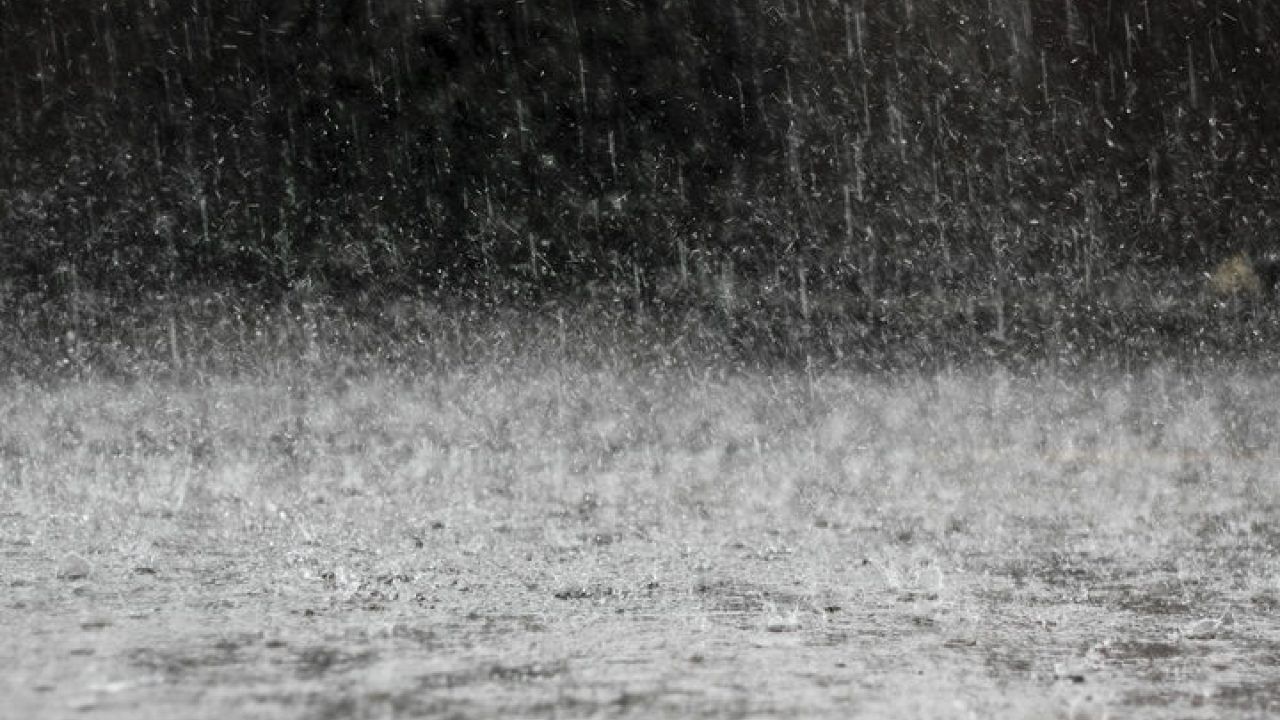
If the old adage is anything to go by, May should bring plenty of flowers! While seasonal weather patterns like April showers seem to endure, long-term averages show that climate change is fundamentally changing other aspects of precipitation—making heavy rainfall events more common and more intense.
In recent years, an increasing percentage of precipitation has come from intense, single-day events.
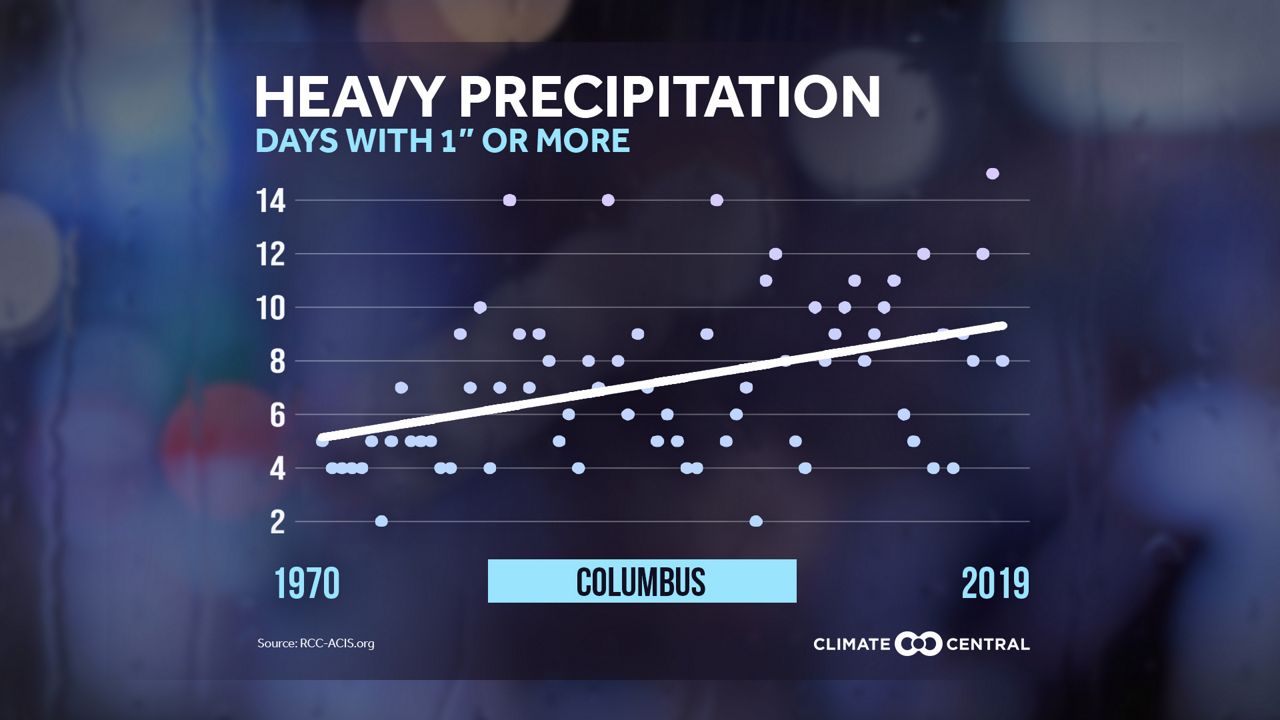
A nonprofit news organization that analyzes and reports on climate science, Climate Central, analyzed how heavy rain events are changing in U.S. cities since 1950.
Since the amount of rain that falls in a heavy rain event varies dramatically from the Desert Southwest to the downpours of Florida, this analysis calculated trends in 0.5, 1, 2 or 3-inch events, as appropriate to the location (see Methodology for more details).
Over the past 70 years, 79% (191) of the 242 stations analyzed recorded an increase in heavy rainfall. In a warming climate, not only does more water evaporate into the atmosphere (roughly 70% of Earth is made of water), but the atmosphere is also capable of holding more water vapor — for every 1 degree F increase in temperature, the atmosphere can hold approximately 4% more water.
This supercharging of the water cycle is making for an increase in rainfall events that are more likely to create disruptive and even dangerous conditions in our daily lives.
While adaptation measures can be taken to mitigate the impacts of heavy rain, reducing greenhouse gas emissions is the only way to begin stabilizing our climate and water cycle.
Extreme rainfall patterns are changing due to climate change. A warmer climate supercharges the water cycle by causing more water to evaporate and allowing the atmosphere to hold more water vapor.
Flood defense infrastructure can help to mitigate the risks of heavy rainfall, but reducing greenhouse gas emissions is the only way to stabilize both our climate and water cycle.
Methodology: Climate Central analyzed the annual number of calendar days with rainfall totals exceeding certain thresholds (inches). Specific thresholds were determined based on the largest daily threshold in inches that occurred at least two times a year on average. Rainfall amounts are from the Applied Climate Information System. Trends are based on a mathematical linear trend line, beginning in 1950 for consistency between stations. Only 242 of our 244 stations are included in summary statements due to large data gaps in St. Johnsbury, Vt. and Wheeling, W. Va.