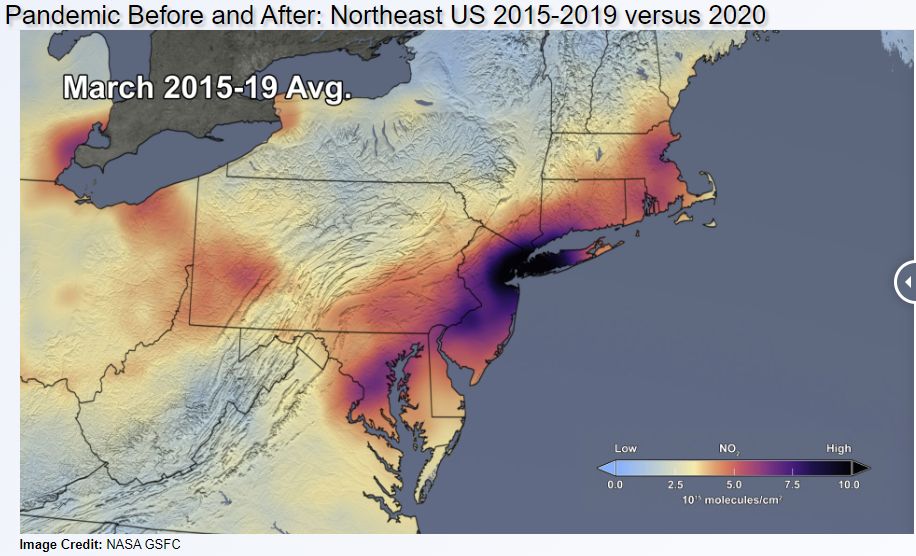
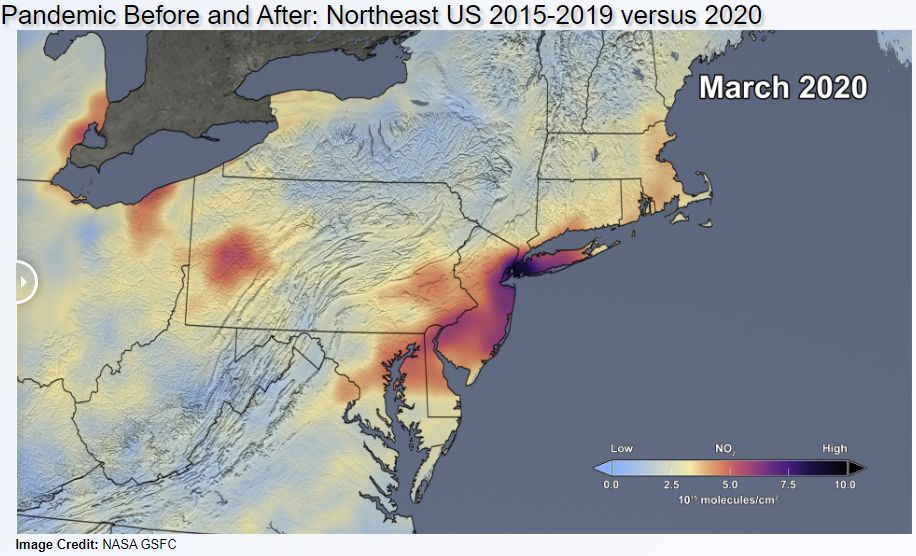
The sudden drop in travel during COVID-19 is causing major improvements in short-term air quality. We track these changing travel patterns using daily mobility (cellphone) data. In March and April, all 50 states saw mobility drop by more than half at some point, relative to a pre-pandemic levels. In 26 states, this maximum decrease was more than 90%. As travel plummeted, March NO2 levels fell about 30% in the Northeast and 40% in the Southeast, relative to a 2015-2019 baseline. NO2 is one of the smog-forming NOx pollutants, and more than half of their emissions come from transportation. Many of these changes won’t last, as travel rebounds and hotter, sunnier days lead to more smog.
What You Need To Know
- Air pollution across globe fell through early spring
- Air traffic, other travel drop decreaased weather observations
- Weather forecasts face potential impacts from data loss
But today’s cleaner skies show what lower emissions can do for our health and quality of life. Worldwide, there have been reported 6% reductions in carbon emissions and 40% reductions in atmospheric pollution, especially nitrous oxide emissions [over the last few months]. The pollution drop varies according to geographical location – polluted areas in China, India, Italy and France have seen short-term improvements following the drop of traffic and industrial activities. There was a phaseout of the previous continuous carbon-emission growth after the 2008 financial crisis, but thereafter the emission growth unfortunately continued. This is likely to happen once again when the COVID crisis is over, if no other efforts are made.
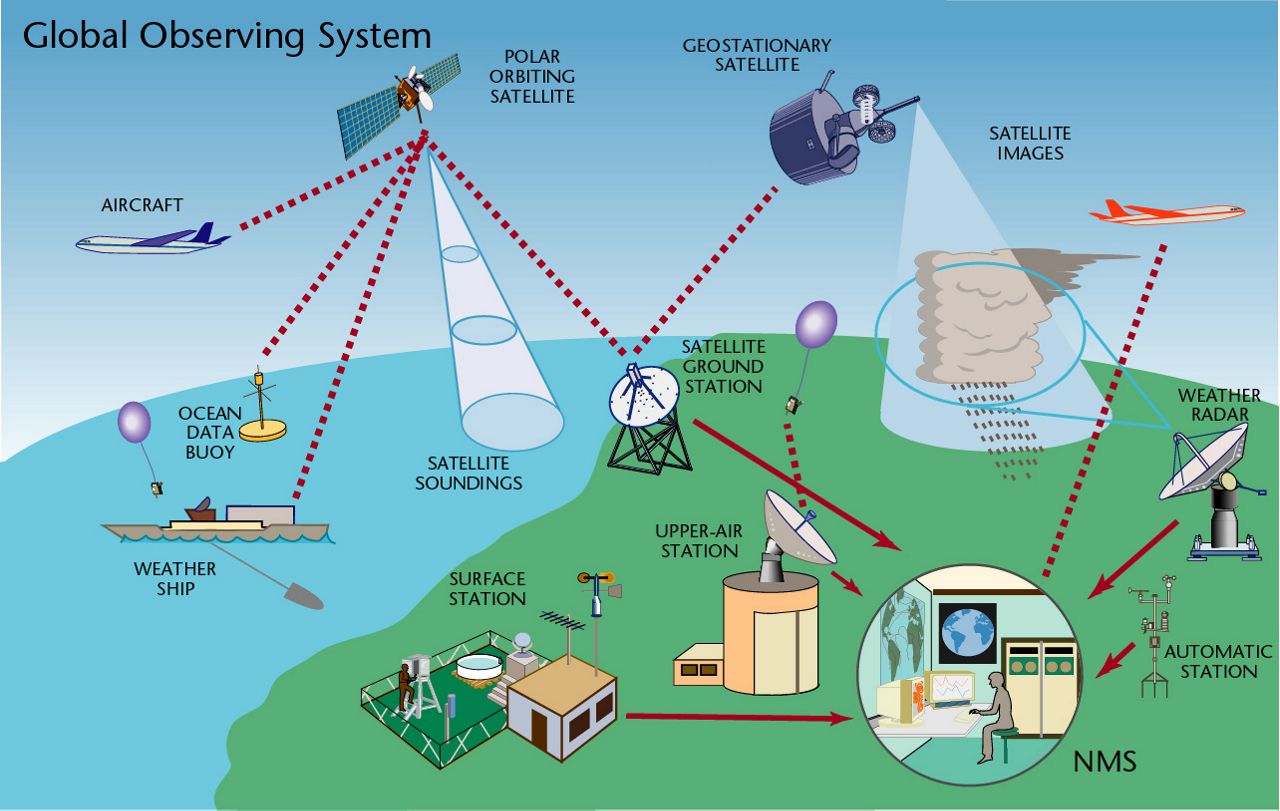
While the crisis had the effect of temporarily reducing pollution, the impact on weather forecasting has been a bit more troublesome. Weather observations around our planet are provided by the World Meteorological Organization's Global Observing System (GOS). This data provides the basis for any predictive modelling of weather and climate. Numerical weather prediction is what is mathematically called an initial value problem – the initial value comes from the observations, and without those no model predictions can be made. Fortunately most parts of the GOS continue to function despite the challenges of the pandemic, albeit at a reduced level for some components. According to Lars Peter Riishojgarrd, director of WMO's Earth-system branch, there are three major areas of impact.
First, the observations provided by commercial aircraft are currently down to about 25% of normal in terms of volume.
Second, we are already seeing substantial reductions in standard meteorological observations in those parts of the world where automation has not yet been widely adopted – locations in Africa, South and Central America.
And third, there are challenges for the marine parts of the observing system: ships, floats, drifting and moored buoys. Most of these systems are automated, but planned repair, maintenance and resupply work is currently halted, and we are seeing a slow decline in observation numbers as a result.
The impact of the COVID-19 crisis is likely to be asymmetric also in terms of its impact on weather and climate prediction. The biggest impact on the availability of observations is seen in the regions that were already the mostly poorly observed, notably Africa and the small island states everywhere on the globe. There is very little redundancy and resilience in the observing system in those areas. In terms of impact on specific weather situations, this will not be fully known until after the crisis is over and statistical studies can be done over a period of time.
In the United States data declined by 75 percent during the pandemic, according to the National Oceanic and Atmospheric Administration. Under the observational program, established in the 1960s, data from 3,500 aircraft operated by Delta, United, American and Southwest, and by the cargo carriers United Parcel Service and FedEx, is transmitted directly to National Weather Service forecasting operations.
With the reduction of meteorlogical data from commercial flights, the use of radiosondes has increased during the COVID-19 pandemic. Radiosondes are small instrument packages flown under weather balloons that rise up through the atmosphere some 10 to 20 miles, transmitting measurements of wind speed, temperature and humidity back to the ground. These are flown over all the world twice per day. But over Europe where aircraft observations have been drastically reduced, some meteorological services have increased their radiosonde flights to try to make up for the lack in aircraft data. Most of the data reduction has been over South America and Africa, along the the Middle East and India. There has also been a reduction in marine observations.
On a positive note, the present situation demonstrates the importance and stability of the space-based observing system component, on which WMO Members, including the US, are increasingly relying. Currently, there are 30 meteorological and 200 research satellites, providing continuous, highly automated observations. The satellites are operated by members of the Coordination Group for Meteorological Satellites (CGMS) and of the Committee on Earth Observation Satellites (CEOS). While in the short run the space-based observing system component is expected to remain unaffected and fully operational, WMO is in contact with meteorological satellite operators to assess the possible long-term impact of COVID-19.
Studies are currently being conducted to see how the loss of weather data is impacting forecast. The current analysis is that an unequivocal impact has not been seen as of yet. But the analysis has yet to be fully completed.