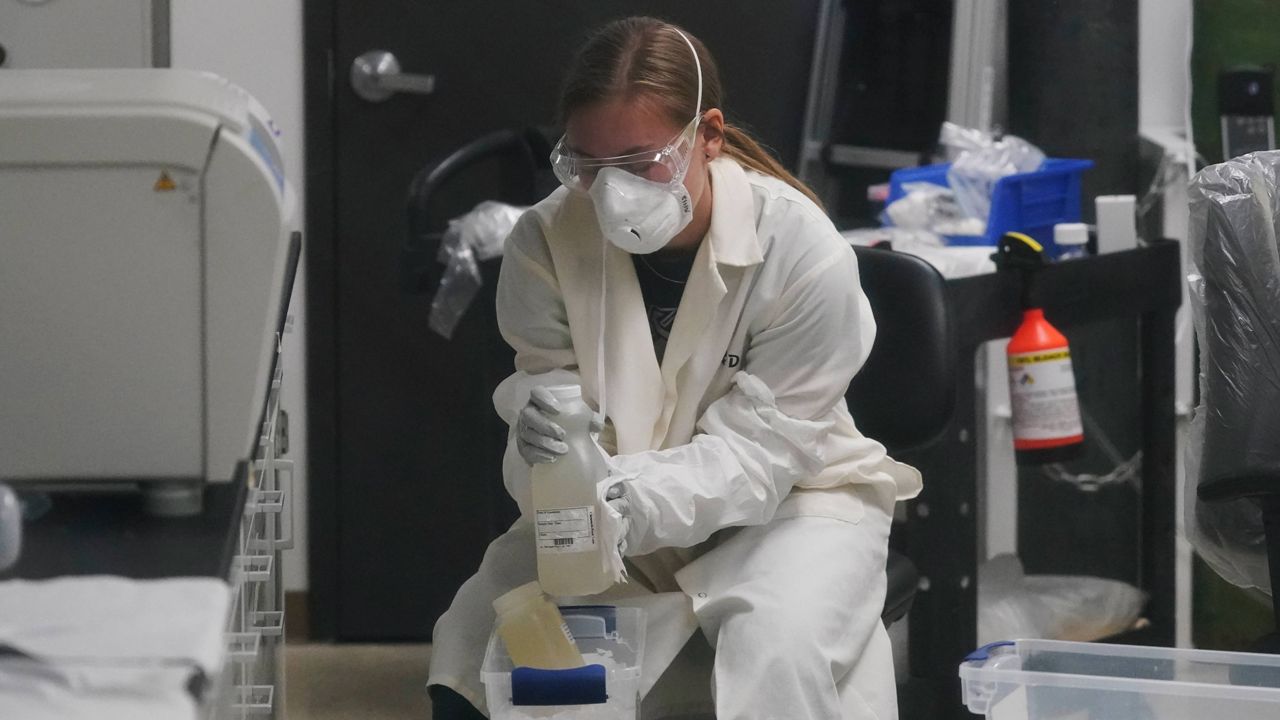
As unsavory as it may sound, wastewater samples are helping to identify emerging trends in the COVID-19 pandemic. However, much of that data has been inaccessible to the public.
What You Need To Know
- The Centers for Disease Control and Prevention announced that it has added wasterwate surveillance to its online COVID-19 tracker
- The CDC's Amy Kirby called it “the latest public health tool that's providing critical information on COVID-19 trends"
- Kirby said that an estimated 40% to 80% of people infected with COVID-19 shed the virus in their feces
- Public health experts say wastewater surveillance can help address some of the weaknesses associated with relying on clinical cases to be reported and provide earlier glimpses into emerging COVID-19 trends
But on Friday, the Centers for Disease Control and Prevention announced that it has added wasterwate surveillance to its online COVID-19 tracker, which also includes information on cases, deaths, hospitalizations, vaccinations and more.
In a call with reporters, Amy Kirby, program leader for the CDC’s National Wastewater Surveillance System, called the method “the latest public health tool that's providing critical information on COVID-19 trends, as well as giving us a glimpse into a new frontier of infectious disease surveillance in the U.S.”
Kirby said that an estimated 40% to 80% of people infected with COVID-19 shed the virus in their feces. Public health experts say wastewater surveillance can help address some of the weaknesses associated with relying on clinical cases to be reported, including the exclusion of asymptomatic cases and mild cases detected using at-home tests that were not reported to health officials.
Meanwhile, COVID-19 trends — such as increases or decreases in cases or the emergence of variants — generally are identified in sewage samples well before clinical cases are reported.
“The information generated by wastewater surveillance offers public health officials a better understanding of COVID-19 trends and communities,” Kirby said.
“If you see a new strain that's coming into your community or that the rates in wastewater are starting to go up, you want to take all the same actions — masking, distancing, getting vaccinated if you're not, testing if you're feeling sick. With wastewater, you can start doing those a few days earlier, and those extra days can really make a difference in the ultimate trajectory of that surge.”
The information can also help public health agencies forecast changes in hospitalizations, giving them more time to prepare for surges, Kirby said.
The CDC began monitoring wastewater in September 2020. It has collected more than 34,000 samples and is supporting surveillance efforts in 37 states, four cities and two territories, Kirby said.
There are currently 400 testing sites around the country providing data to the CDC, with at least 250 more expected to come online over the next few weeks. Even more will be added over the coming months.
The data available on the CDC’s website show how virus levels in wastewater have changed in communities over the previous 15 days, as well as the percentage of tests from the past 15 days that were positive.
Dots on a map corresponding to testing sites, or “sewer sheds,” are color-coded to show whether cases are rising or falling in certain communities. For example, Lucas County, Ohio, which has experienced a whopping 670,522% increase over the past five days has a dark red dot. Newton County, Missouri, where cases have plummeted by 99%, has a dark blue dot.
The sewage data also can be used to provide an apples-to-apples comparison across states, Kirby said. The same method can be used to track polio, illegal drugs and obesity, experts say.
The CDC, however, did acknowledge that wastewater surveillance is not a perfect gauge. It can’t be used in communities with minimal or no sewer infrastructure, or in communities with transient populations, such as popular tourist destinations.
Wastewater monitoring also cannot determine whether a community is free of infections, Kirby said.


