For more than 20 years, the United States Drought Monitor has ranked the drought situation throughout the country every week.
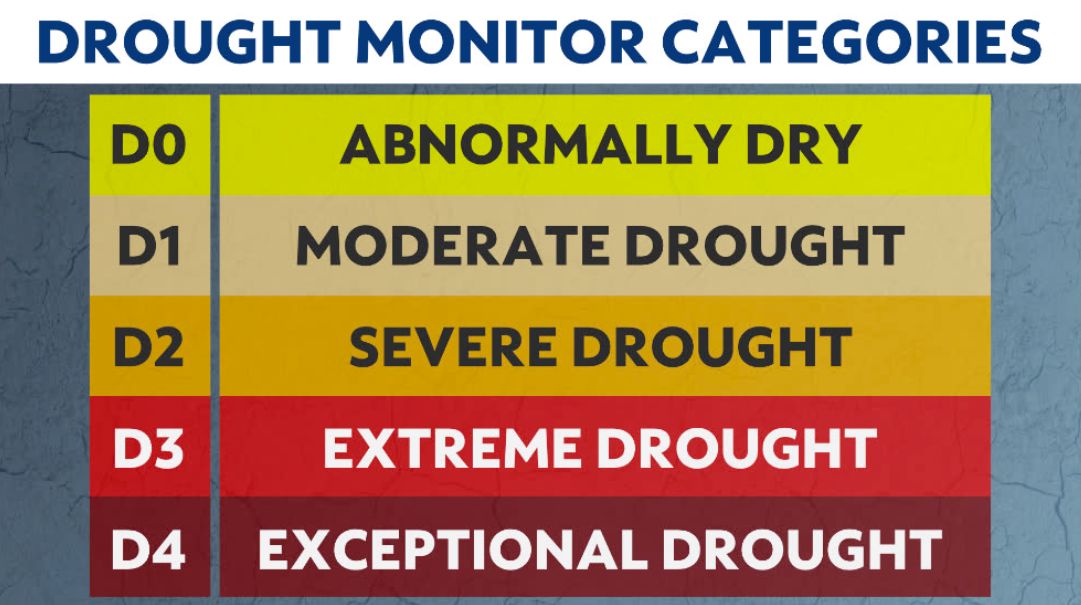
The Drought Monitor has five categories, ranging from “abnormally dry” to “exceptional drought.”
The D0 level isn’t technically drought, but a signal that an area is nearing drought or coming out of it. The worst drought level is “exceptional,” leading to crop failures and significant water shortages.

The impacts of each level of drought change from place to place. See what it means where you live by going here and picking your state.
Three groups work together to create the map that comes out every Thursday morning: the National Drought Mitigation Center at the University of Nebraska-Lincoln, the U.S. Department of Agriculture and the National Oceanic and Atmospheric Administration.
A volunteer from one of those groups makes the update, looking at all sorts of information leading up to Tuesday that week. They check more than just precipitation. There are river levels, snowpack, soil moisture, vegetation health and more.
In fact, the authors look at dozens of drought indicators, according to Brian Fuchs, a climatologist at the National Drought Mitigation Center. He adds that response to drought, such as watering restrictions, doesn’t factor into making the drought map.
Drought is often a widespread and slow-to-change problem. While we can’t do anything to stop it, people do use the Drought Monitor to deal with its effects.
Some places will issue water restrictions based on drought levels, while federal programs use it to aid farmers and make disaster declarations. Dry conditions can increase wildfire risk, affecting preparations in fire-prone areas.


