


Most people are familiar with high and low pressure, but did you know these differences in pressure drive all weather?
Air moves from high to low pressure as the atmosphere tries to reach an equilibrium. On the way, it encounters more variation—differences in temperature, humidity, and stability.
These changes are important not only over a horizontal surface, but vertically as well.
It might be hard to imagine the atmosphere in 3D, but you experience it when you fly on an airplane.
As the airplane takes off, you’re leaving the surface. As you hear the ding and the flight attendant tells you it’s safe to use electronics, you’ve crossed 10,000 feet—another important meteorological pressure level, 700 millibars. As you reach cruising altitude, you’ll typically be around 30,000 feet or 300 millibars.
There are several important vertical markers in the atmosphere for meteorology: 1000, 925, 850, 700, 500, and 300 millibars.
These pressure levels are not fixed, meaning 700 millibars is not always found at 10,000 feet—the actual height varies based on temperature of the air in a given location, typically by a margin of a couple thousand feet.
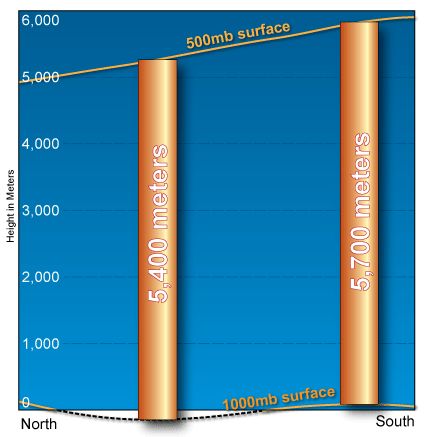
High pressure is associated with warmer air columns and low pressure is associated with cooler air columns. As air warms, it expands and as air cools, it contracts—so warmer air columns get “taller” and cooler air columns get “shorter.”
The temperature of an air column is typically examined at the 500 millibar level by examining the height of that pressure surface. This is arguably the most important pressure level for determining weather patterns because it is the middle of the atmosphere, halfway between 0 and 1000 millibars. The National Weather Service says if meteorologists could look at just one chart, this would be the top choice.
Once again, the 500 millibar level is not fixed—it varies based on the temperature at a given location, so the height of that surface will fall with cooler air and will rise with warmer air.
The 500 millibar pressure level varies generally from about 17,000 to 19,000 feet. Meteorologists use this level to determine where troughs (lows) and ridges (highs) are forming, which tells us about temperature—troughs lead to cooling and ridges leading to warming.
You can do this analysis yourself with the following image by looking at the numbers on the constant height lines.
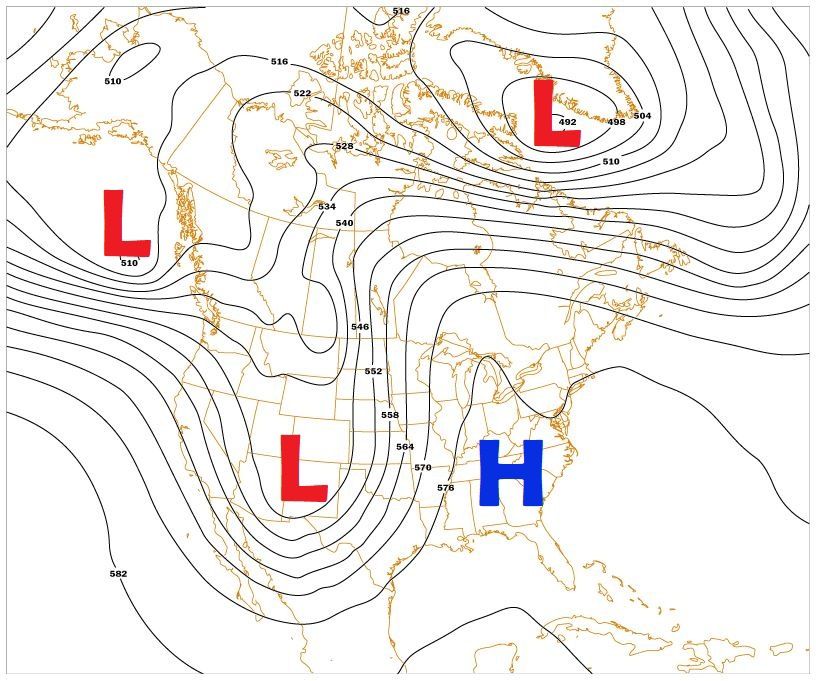
Persistent ridges can be found at times over the United States, especially during the summer. This pattern is ongoing with dominant high pressure taking up real estate over the Southern Plains and edging back towards the four corners region.
This is a frequent pattern because warm air from the equator moves northward in the summer, displacing the polar jetstream to the north.
Heights at 500 millibars have been unusually high in the center of this ridge this July, at or above 20,000 feet. That’s one tall (warm) air column!
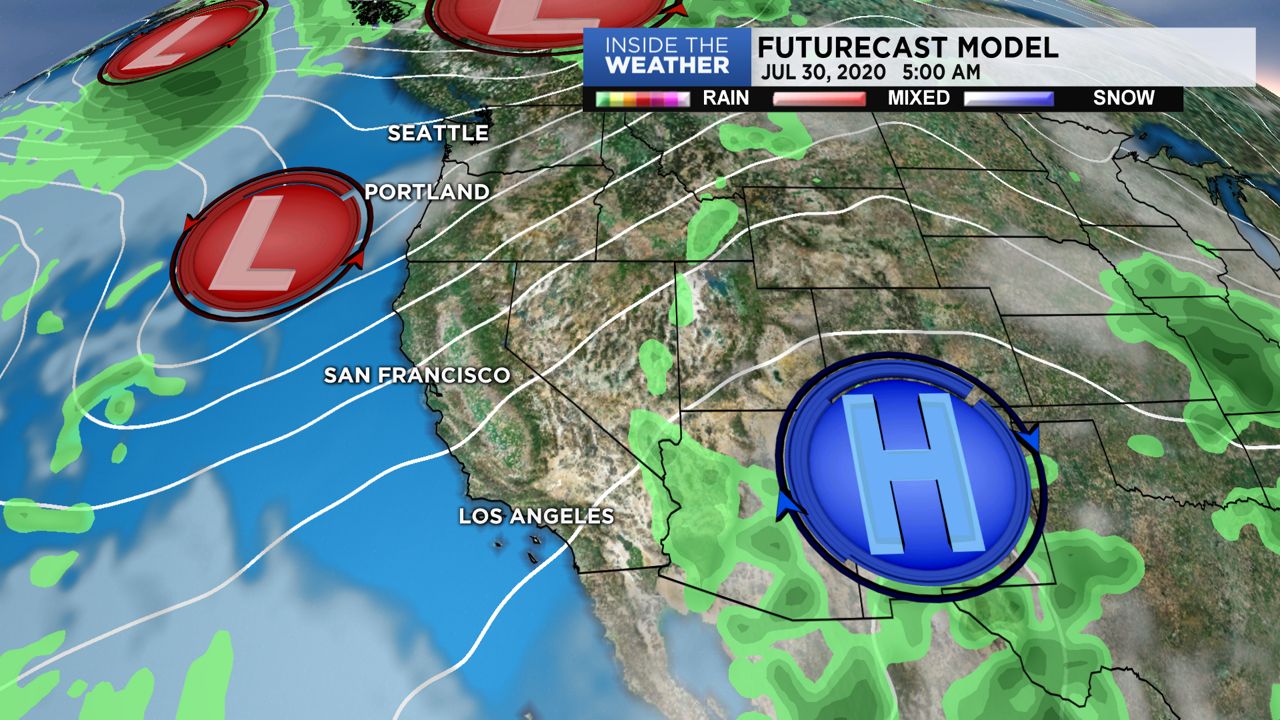
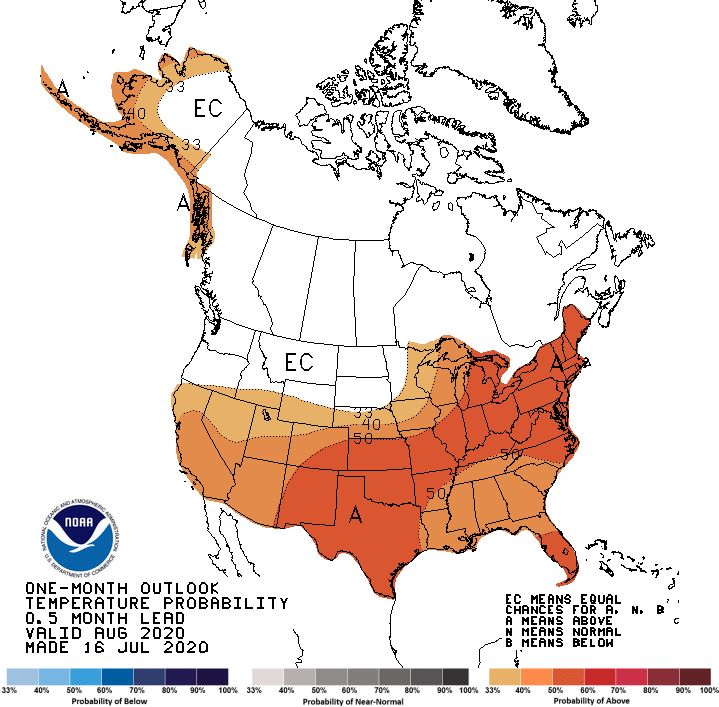
Forecast models show no signs of this strong high letting up, so the Climate Prediction Center is calling for a 50 to 60 percent chance of above-average temperatures in August under the center of the high.
The area of high pressure may expand westward into August, which would mean warmer temperatures for California, too. We'll keep our eye on the 500 millibar chart, and keep you posted!