Now that we have made it to the month of July, that means we have officially started the new meteorological rainfall season. The meteorological rainfall season measures rainfall totals here in California from July 1 of the previous year to June 30 of the current year.
What You Need To Know
- Southern California experienced above-average precipitation in November and December 2019
- February 2020 was one of the driest on record for many locations in southwestern California
- Storms this spring brought significant rainfall back to southern California while northern California remained mostly dry
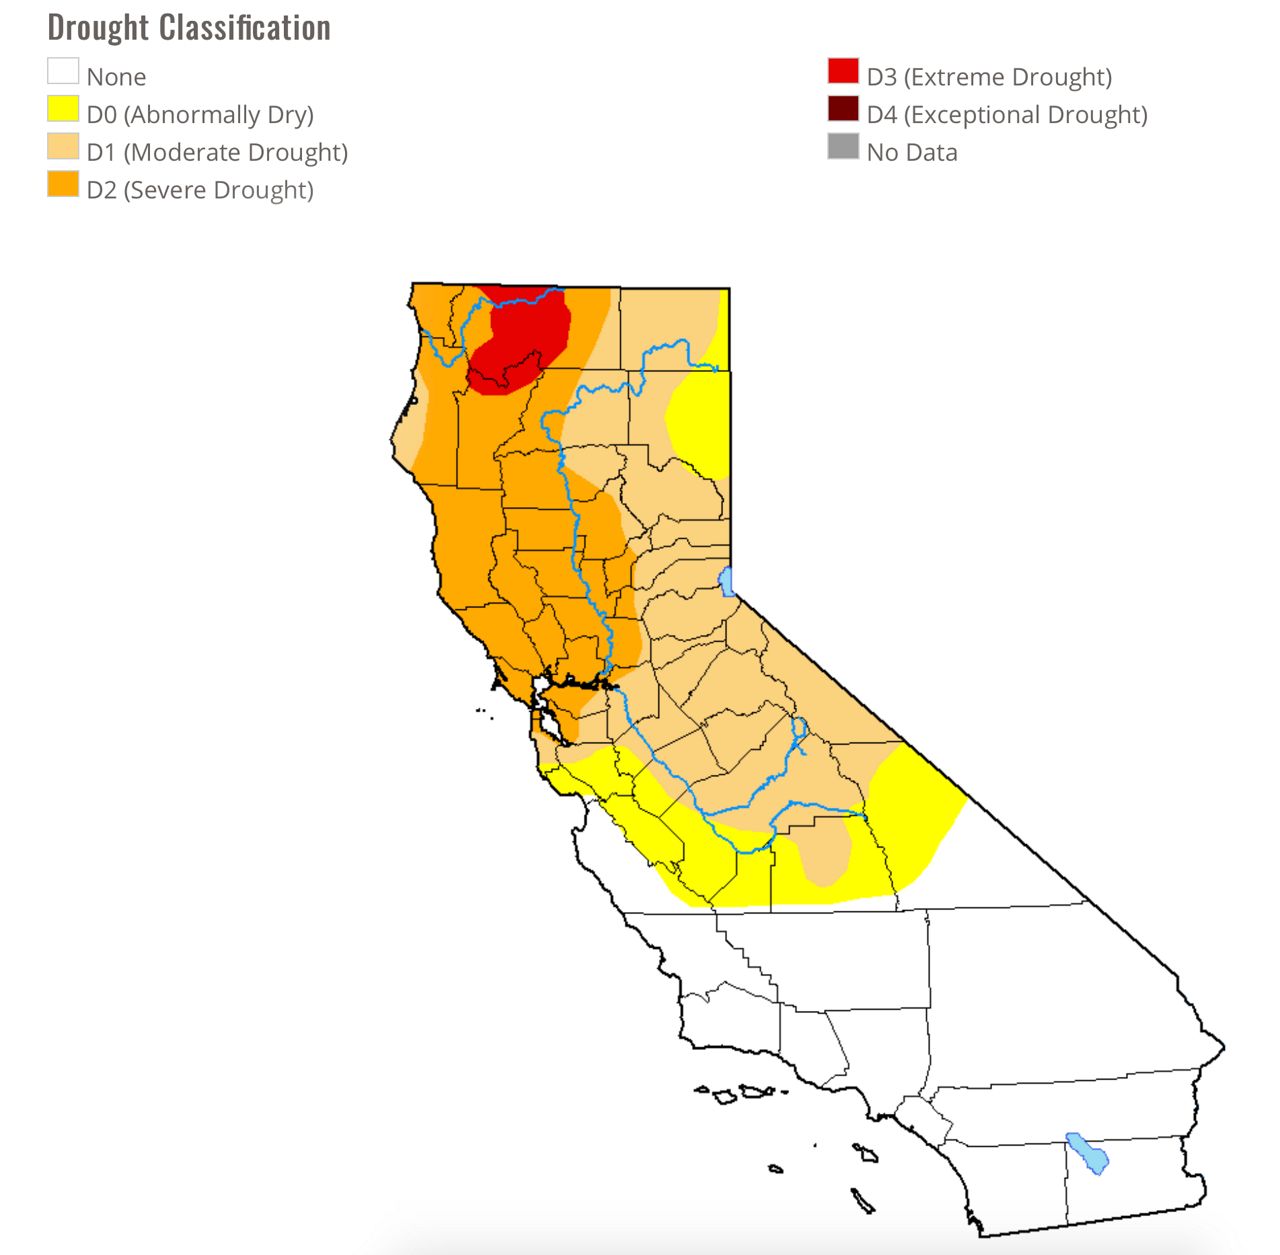
- Currently, 60-percent of the state is now under drought conditions - mainly central & northern California
Let’s take a look back at the 2019 to 2020 rainfall season and review the precipitation data we saw over the course of the year.
To recap, the state experienced several cold storms between November and December, bringing above-average precipitation to many locations through Southern California.
Following that, dry conditions took us through the heart of winter in January and February, which are normally the wettest months of the year. Many portions of the state even recorded the driest February on record, while we normally see the highest precipitation totals during these two months.
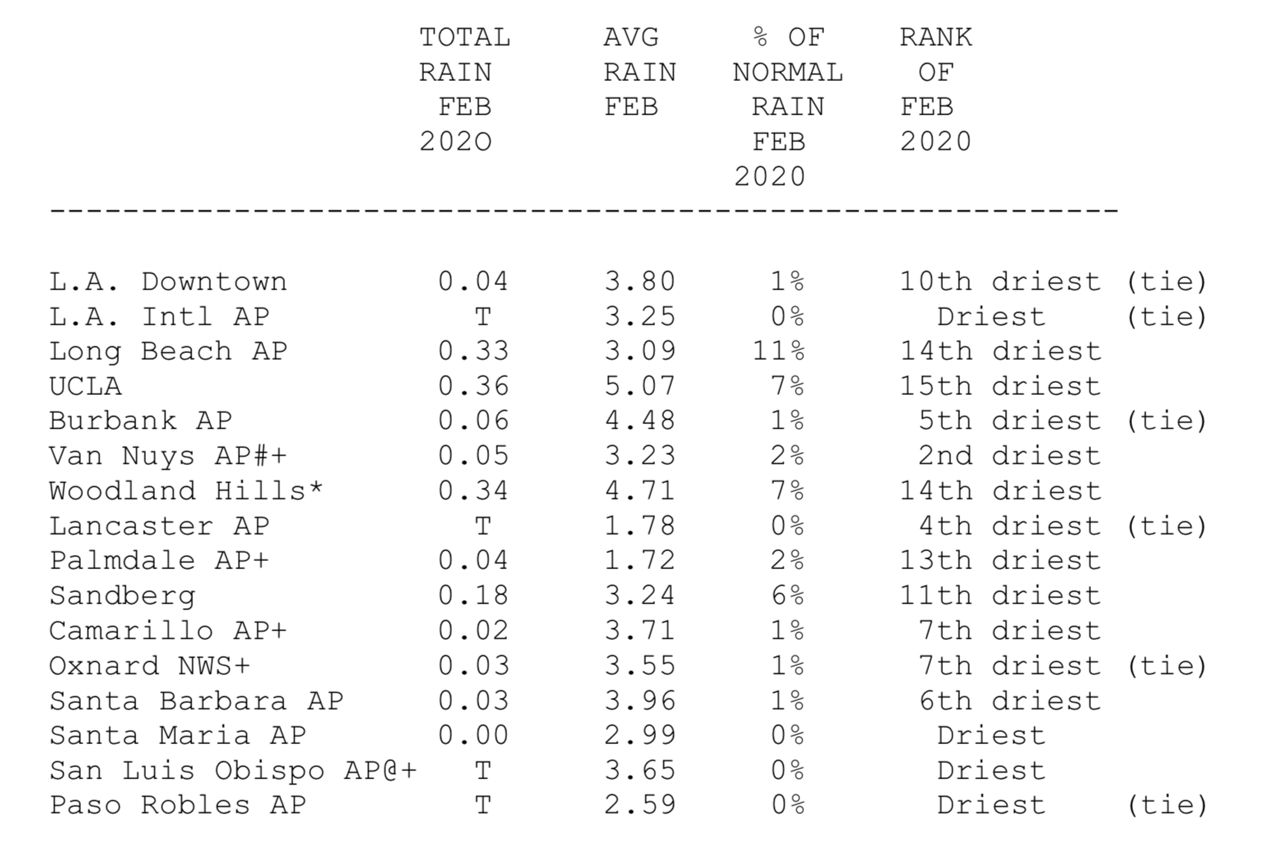
According to the National Weather Service (NWS), “most places received less than 5-percent of normal rainfall in February.” Los Angeles Airport received only a trace of rain that month, tying for the driest February since the records began in 1944.
Downtown Los Angeles received 0.04 inches of rain for the month, tying February 1899 for the 10th driest February since the records began in 1877. For the month of February, Burbank Airport tied as the 5th driest, Van Nuys Airport tied as the 2nd driest and Lancaster Airport tied as the 4th driest.
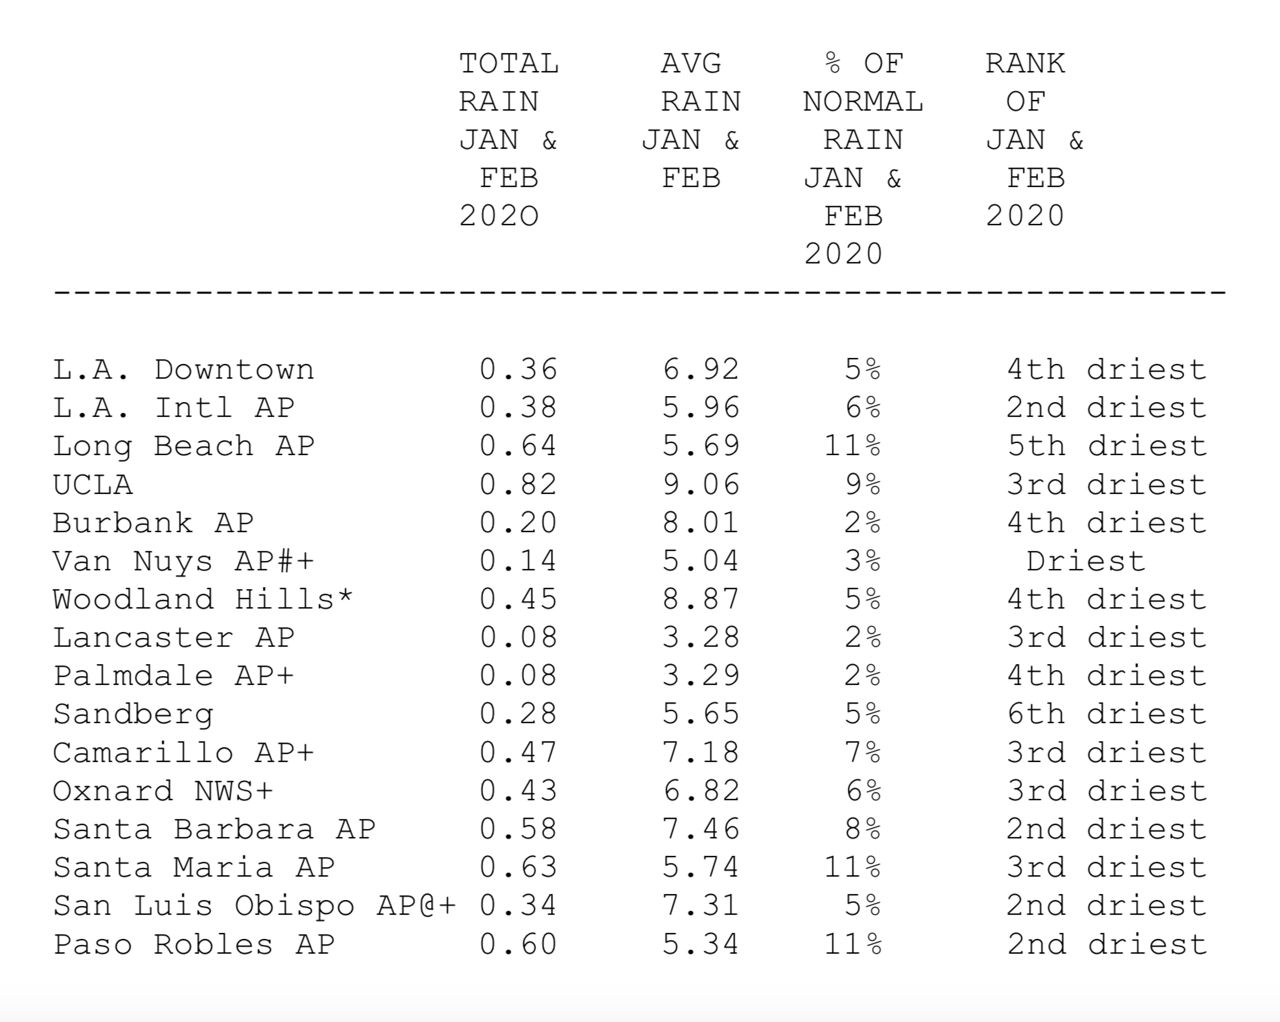
“The combination of a very dry January and an even drier February made for one of the driest first two months of any calendar year on record across much of Southwestern California. In fact, it was among the top 5 driest at nearly all locations. Rainfall generally averaged well less than 10-percent of normal for the two month period in most areas,” according to the NWS.
In Downtown Los Angeles for example, 0.36 inches of rain fell during those first two months of the year. Compare that to the average amount of 6.92 inches that we usually see combined from those two months.
For Downtown Los Angeles, it was the 4th driest January/February combinations since the records began. Van Nuys Airport ranked as the driest January/February combination within the last 25 years.
That airport only picked up 0.14 inches of rain, compared to the average of 5.04 inches.
Luckily, many storms during March and April brought significant rainfall to Southern California that made up for the precipitation deficits from January and February. Unfortunately, this was not the case for the rest of the state, and drought conditions began creeping back into Central and Northern California during those months.
According to the California Department of Water Resources, state-wide snowpack conditions at the end of April were below 50-percent of average for that date.
Warmer and drier weather took us into May, where we saw light rain at times. Similar conditions took place during June as temperatures began really warming up.
Now that we covered the cliff notes version of the rain activity this past year, let’s discuss totals for the year. Even with the few months of very dry weather, we actually were able to catch back up to average in many Southern California cities.
Some cities actually climbed above average while others were only slightly below. Northern California rainfall totals for the year were well below average, especially through the Sierra, which is where the majority of the state’s water supply comes from. The Northern, Central and Southern Sierra only received about 58-62 percent of the normal rainfall for the year.
Other portions of Northern California received anywhere from about 40-80 percent of normal rainfall. In contrast, most Southern California cities were over 75-percent of normal, and went all the way up to about 150-percent of normal. You can see the breakdown of rainfall totals for the various parts of the state below.
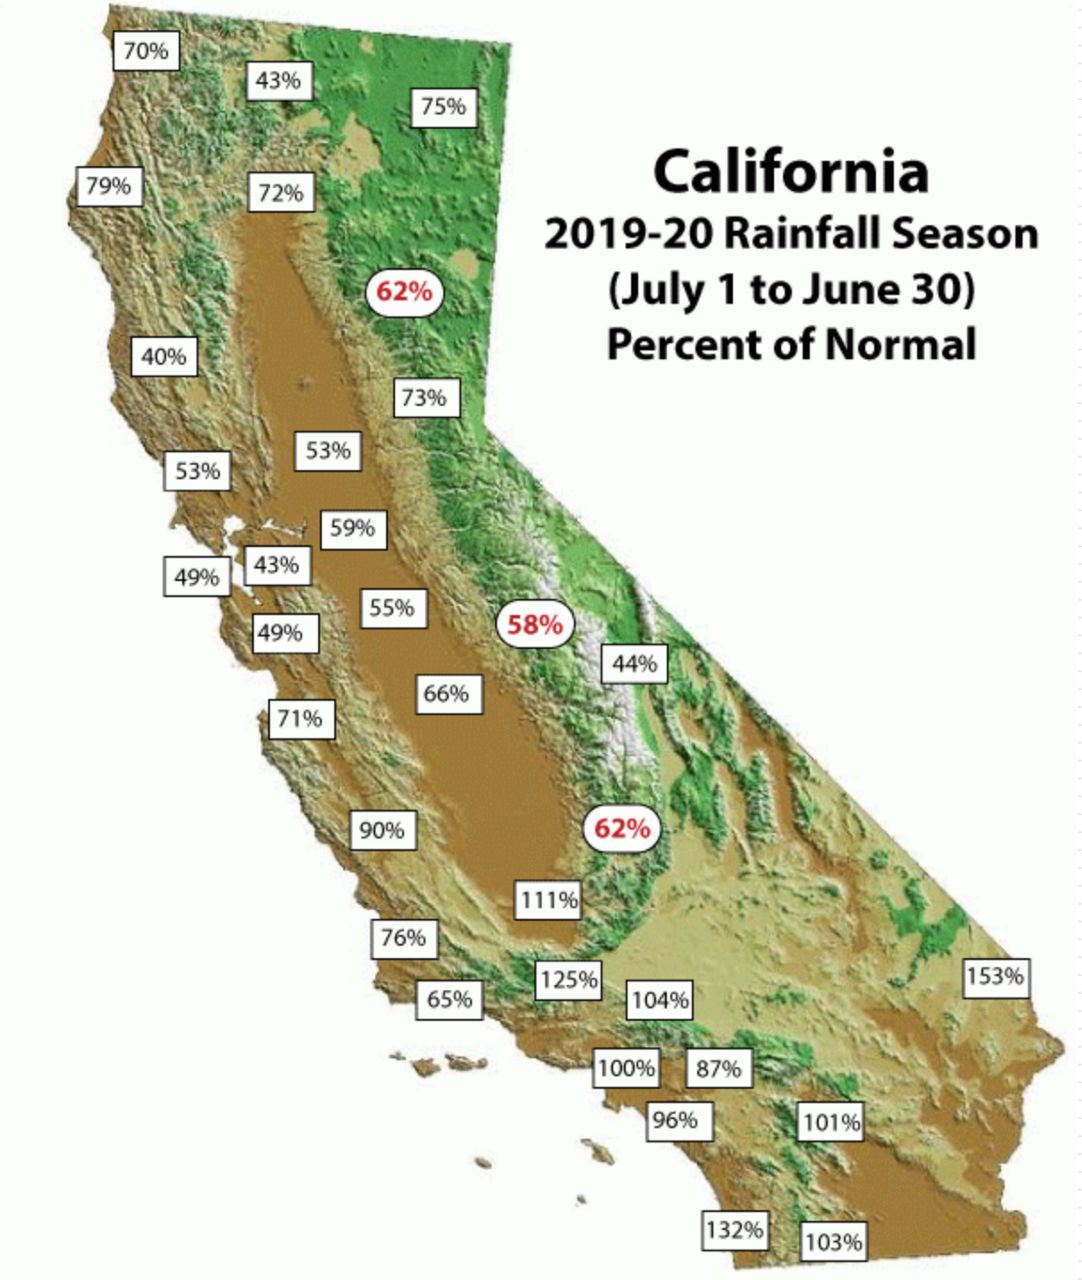
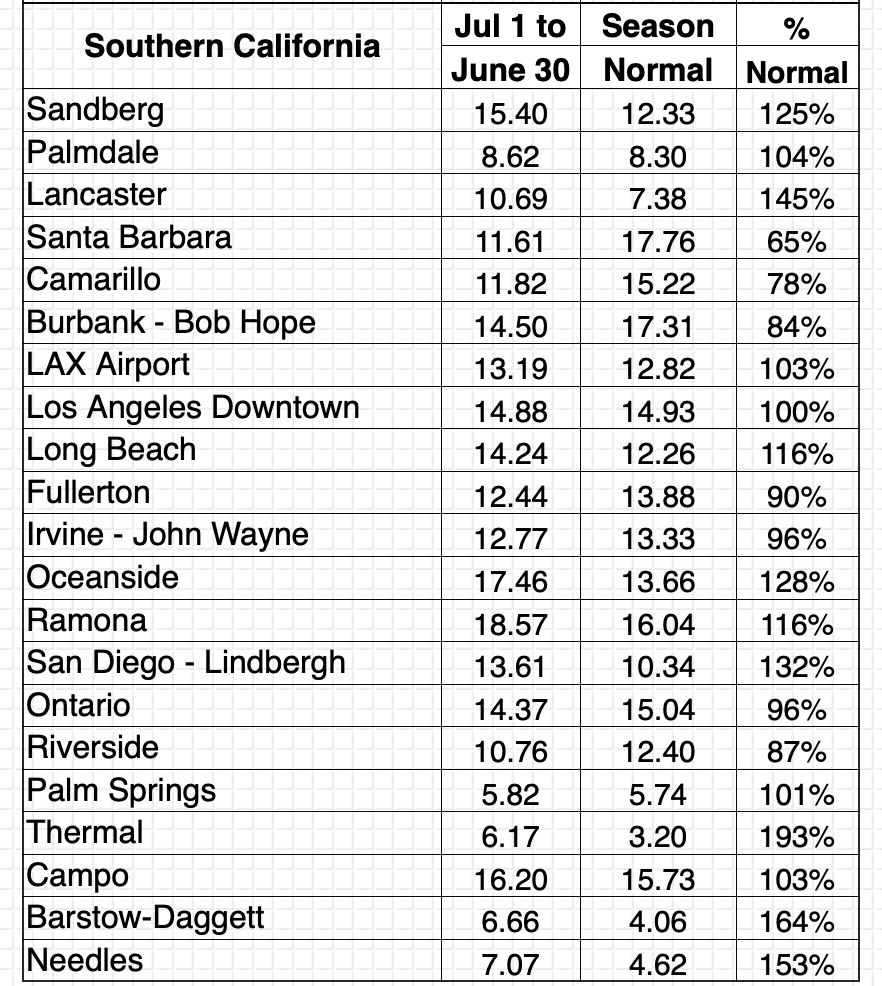
A full breakdown of rainfall totals compared to seasonal averages for California can also be found here.
To compare rainfall totals from this year to previous years, you can also visit this page.
Overall, Southern California ended up in a good place for the year where rain totals were concerned. Central and Northern California now show four different categories of drought.
That means that 11-million people are living in drought areas within the state. On July 2, 2019, only about 4-percent of the state was under abnormally dry conditions, which is the lowest intensity on the drought monitor scale.
That also means that the majority of the state was also free of any drought.
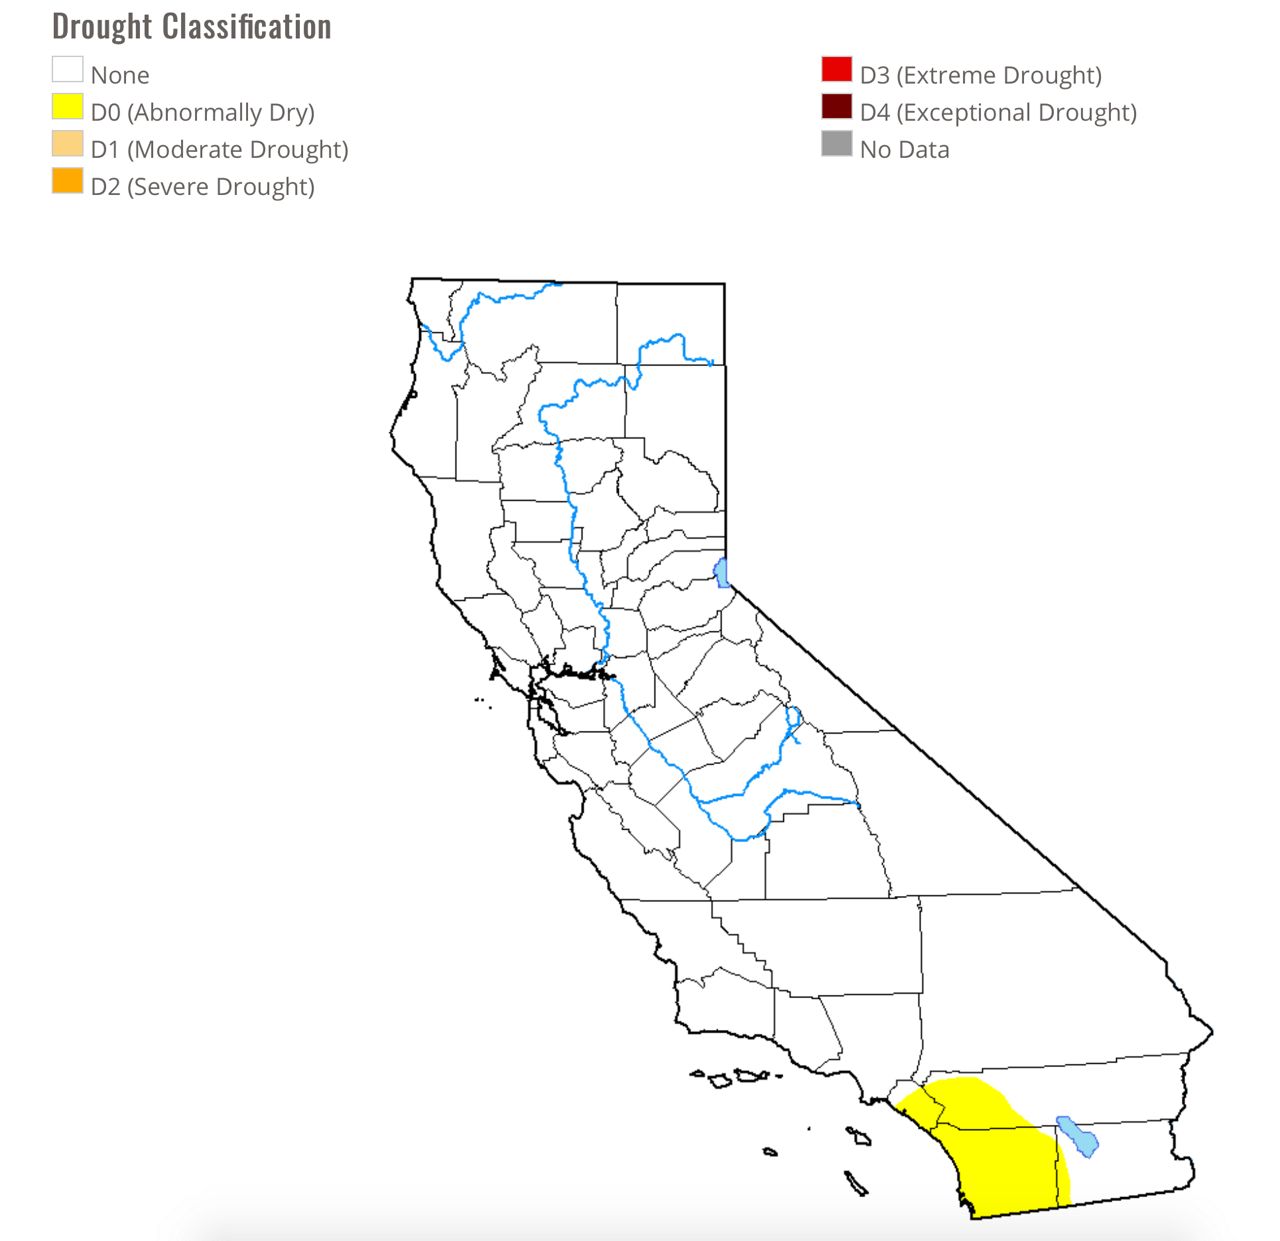
Now, as of June 30, 2020, almost 60-percent of the state is under drought conditions, ranging from abnormally dry to extreme drought. Southern California is in the clear thanks to the rainfall we were lucky enough to receive in March and April.
