


NEWPORT BEACH, Calif. — According to a study by the U.S. Geological Survey, Southern California could lose up to two-thirds of its beaches by 2100 if sea level rises three-to-six feet and human intervention is limited.
What You Need To Know
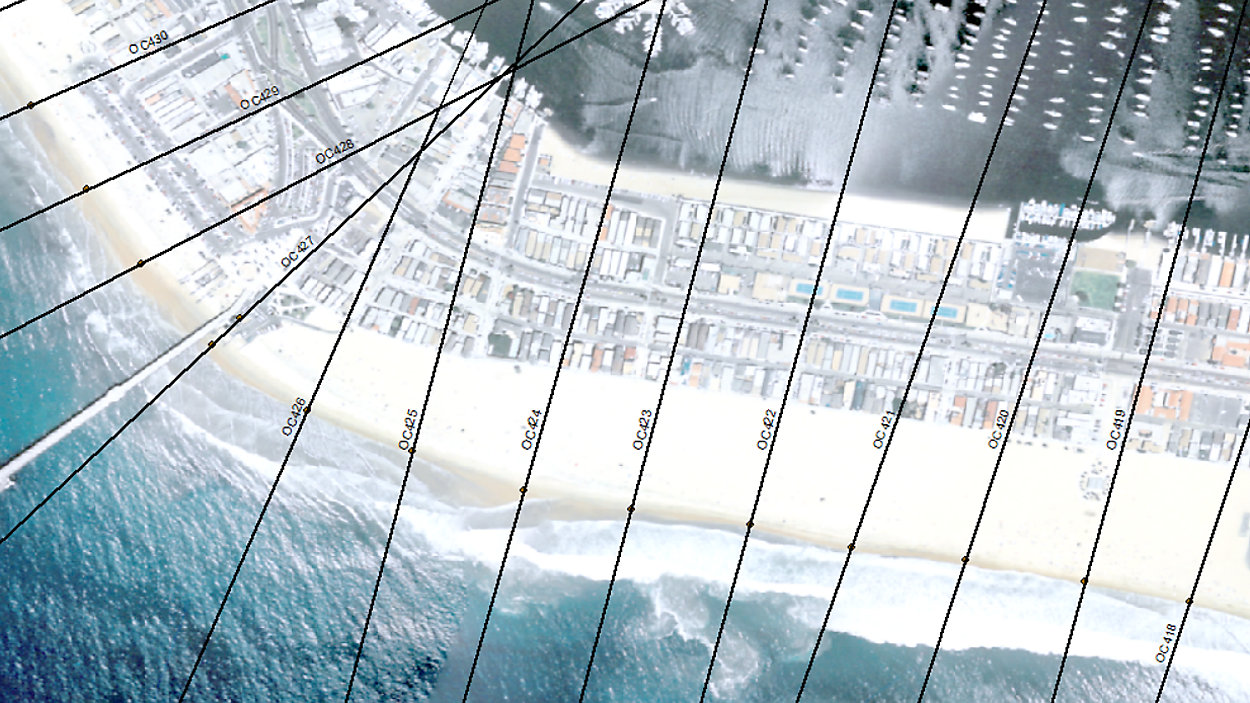
- Beach measurements uses the darkest or wettest point in the sand to where a sidewalk or other infrastructure begins
- Undergraduates are using their civil engineering skills to mark points on images of the beach
- The team is about half-way through beaches in Orange County
- Project will include beaches in Orange, Los Angeles, San Diego, Ventura and Santa Barbara counties
A team of students at the University of California, Irvine is working to document how much the beaches have narrowed using just pictures of the beach.
One of the students is Victoria Lee, third-year civil engineering major.
Just like many people who live in and visit Southern California, Lee likes to get her beach time in as much as she can.
“A couple times a month, for sure, at least,” she said.
It is one of the reasons Lee attended UCI.
“It’s by the coast and it’s like a 10-minute drive from campus. I really like beaches. And I really hope that beaches will be here for people to enjoy for future generations,” she said.
For that reason, she is part of the university’s 100 by 100 Beaches Project. Lee explained that it's a “project where we measure beach change over 100 years, every 100 meters.”
The focus, according to Lee, is beach erosion. She recently visited Newport Beach to look at a spot near The Wedge. She took notes about what she was seeing in the field. She explained the measurements of the beach every 100 meters would be based on a particular point in the sand.
“We look for the most wetted area of the beach. On this beach it would actually be right here where the water is coming up and creating this dark line all the way down the coast,” she said as she pointed toward the water line created by the ocean water running up the shoreline.
Lee noted that in a picture, it would be darker than other areas of the sand.
“Our measurement would be from the darkest line to the sidewalk line,” said Lee.
They do the actual measuring in a lab on campus, using civil engineering skills and software called ArcGIS or QGIS. The team looks at satellite images of beaches dating 100 years back. Lee explained that the students mark the wettest area of the beach, and then they mark it to where a sidewalk or other infrastructure is at the end of the sand.
Lee noted that they wanted to make sure more than one student was looking at each section.
“We have three people per region to make sure that we get the most accurate results that we can,” she said.
Daniel Kahl is a graduate student helping the team of undergrads. He said they would start with beaches in Orange County.
Then the group will eventually hit Los Angeles, Ventura, San Diego and Santa Barbara counties.
Kahl said while they are about halfway through Orange County, they're already seeing interesting things.
“In Newport, you can see when the jetties were added. That is kind of cool. We can see how there’s been a lot of human influences on the beaches. We can see that through historical imagery which one of the more exciting things to see is,” he said.
The team estimates there are about 668 measurements to take.
It's a lot of work, but Lee said it is exciting work.
“It’s becoming such a big problem that the infrastructure is degrading because of the water run up and beach loss, it’s really cool to be able to take this data and give it to future researchers to figure out what solutions they can come up,” she said.
Solutions that Lee said she hopes can help save a place that is so special to her — and many Californians and visitors alike, the beaches up and down the coast.
Eventually, the team hopes to have the measurements available to the public and posted online.